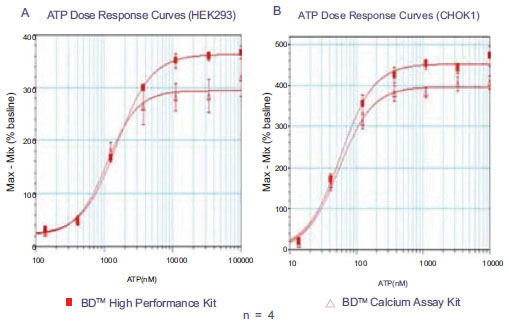
Fig. (2). Response of endogenous P2Y receptor to ATP A. Dose response curves of ATP in HEK 293 cells in the absence of probenecid in 384-well format. Signal to background are 3.9 and 4.6, EC50 values are 1.1 µM and 1.5 µM using the first and second generation kits, respectively.B. Dose response curve of ATP in CHO-K1 cells in the presence of 2.5 mM probenecid in 96-well format. Signal to background are 5.0 and 5.5, EC50 values are 67 nM and 58 nM using the first and second generation kits, respectively.