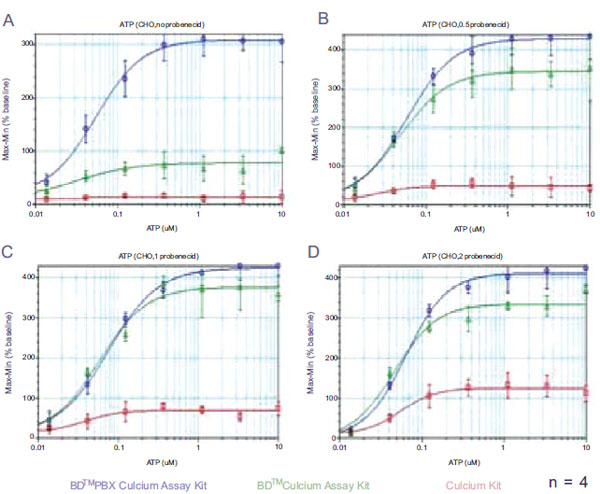
Fig. (5). Probenecid titrations on CHO-M1 cells using different kits in 384-well format A. ATP dose response curves in the absence of probenecid.B. ATP dose response curves in the presence of 0.5 mM probenecid.C. ATP dose response curves in the presence of 1 mM probenecid.D. ATP dose response curves in the presence of 2 mM probenecid.