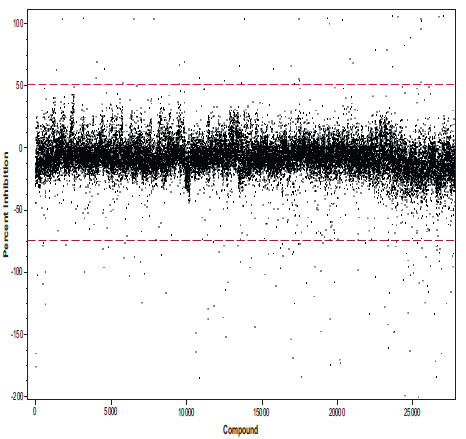
Fig. (6) High throughput screening of a chemical library. The single point screening data is shown in a scattergram showing percent inhibition for each compound tested. The cut-off for inhibition (upper line) and activation (lower line) are shown with dotted lines. Activation values result in negative percent inhibition values. The average Z’-factor using the plate controls was 0.73.