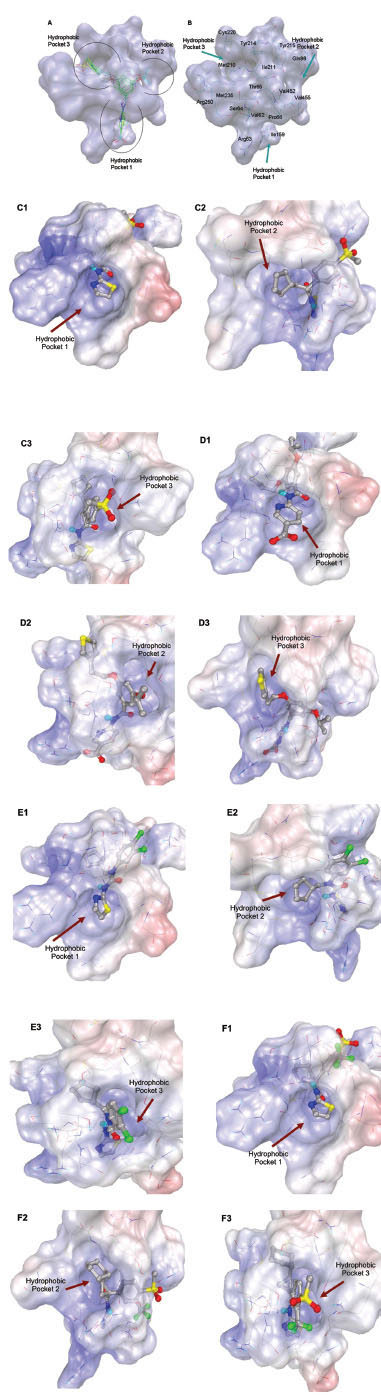
Fig. (2) Hydrophobic pockets of allosteric binding site of GK and binding modes GKAs. A. docked binding pose of class 2 GKAs. B. Amino acid residues at binding pockets involved in binding interactions with ligands at allosteric pocket. C1, C2, C3. Overlay of the electrostatic potential surface map of hydrophobic pockets 1, 2 and 3 respectively with ligand 1 (class I GK) using APBS. D1, D2, D3. Overlay of the electrostatic potential surface map of the hydrophobic pockets 1, 2 and 3 respectively with ligand 9 (class II GK) using APBS. E1, E2, E3. Overlay of the electrostatic potential surface map hydrophobic pocket 1, 2 and 3 respectively with ligand 15 (class III GK) using APBS. F1, F2, F3. Overlay of the electrostatic potential surface map of pocket1, 2 and 3 respectively with ligand 19 (class IV GK) using APBS. Amino acids are represented in line and docked conformations of ligands are shown in ball and stick. Surface color red to blue shows potentials from negative to positive.