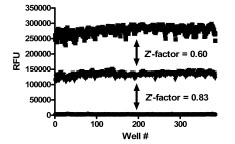
Fig. (5) PAP assay variability assessment. All wells of a 384-well plate were pre-spotted with 0.5 µl of DMSO. Two plates each were used to determine the maximum signal (middle), minimum signal (bottom), and a 2x enzyme concentration (top). The Z’-factors for the inhibition assay window (max/min) and the activation assay window (max/2x) are shown.