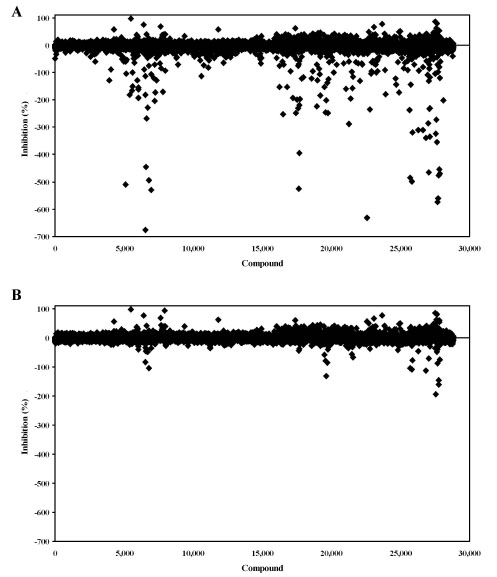
Fig. (7) High throughput screening of a chemical library. The same single point screening data is shown in scattergrams without background subtraction (A) and with background subtraction (B) showing percent inhibition for each compound tested. Activation values result in negative percent inhibition values.