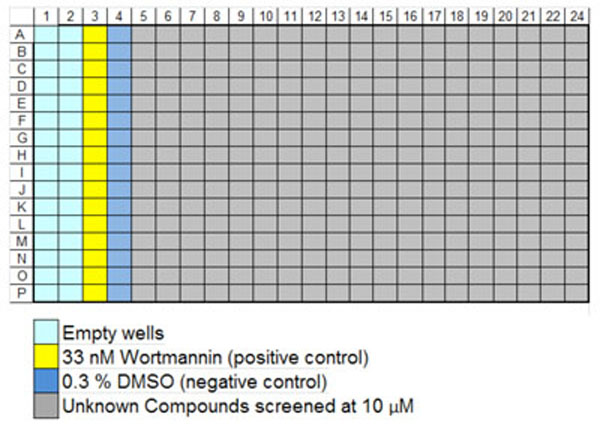
Fig. (3) Plate map of controls and compounds for primary screening. Compounds were run at 10 μM in singlicate (320/plate), along with 16
of each control type on every plate. The results from the compounds were normalized as % plate controls, where appropriate for the feature
measured; features such as Npass (nucleus number) were treated as raw data.