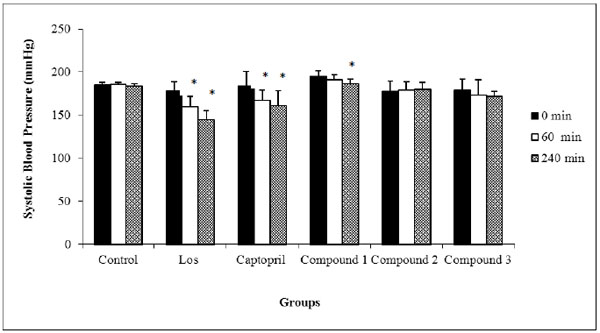
Fig. (4)
SBP of differents groups. Data are expressed as mean ± SD. All groups were compared with their respective Control (Tukey`s test, *
P
< 0,05).