Fig. (11)
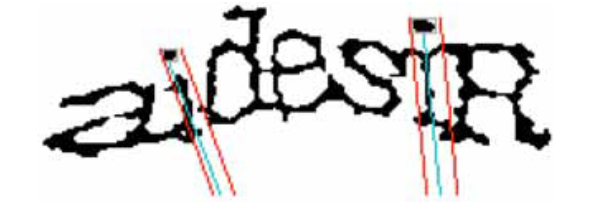
The blue line is the best line to describe the line of the ` i s as calculated from the above algorithm. The area between the red lines is the estimated area of the `
i
'.