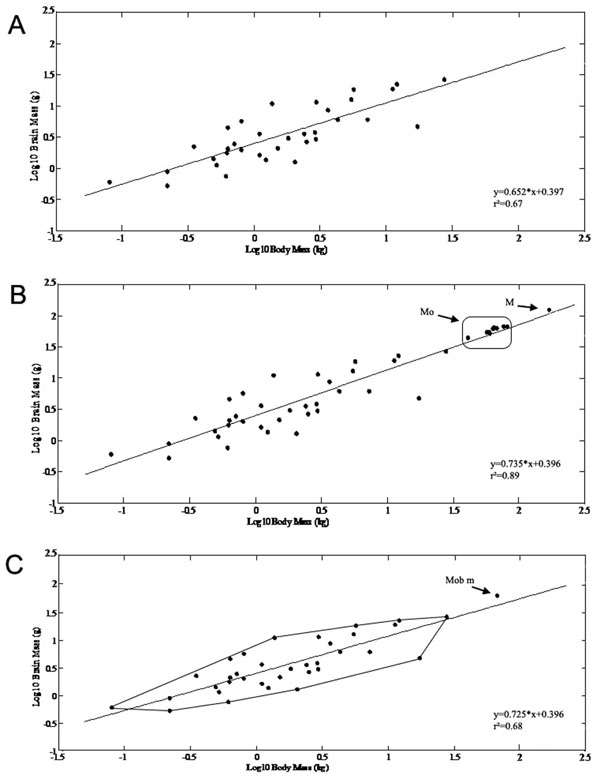
Fig. (1) The allometric equations and their changes are presented after including the Mobulid specimens as independent data points and astheir mean value. X axis: log (body mass in kg), Y axis: log (brain mass in g). A) Brain mass and body mass correlation presented on doublelogarithmic scales for batoids based on data from previous studies [5, 6, 8, 10]. Using 35 batoids as independent data points, the dependent variable (brain mass) increased with the independent variable (body mass) according to the allometric relationship: y= 0.652 x+ 0.397(r2=0.67, n=35). B) Scaling of brain mass with body mass of the Mobulas (Mo) and Manta (M) specimens as independent data points in addition to the previously described species. After including the Mobulid specimens as independent data points in the original dataset, the allometric equation changed to: y= 0.735 x+ 0.396 (r2=0.89, n=48). C) The original minimum convex polygon for batoids is presented in addition to the mean value of Mobulids (Mob m) extending the original polygon. After including the Mobulids using their mean values, the
allomentric relationship was: y= 0.725x+ 0.396 (r2=0.68, n=36) Thus, the newly defined data point changed the slope of the regression line by making it steeper. The Mobula and Manta brain mass/body mass data modified the minimum convex polygon of batoids by extending its
upper boundary.