- Home
- About Journals
-
Information for Authors/ReviewersEditorial Policies
Publication Fee
Publication Cycle - Process Flowchart
Online Manuscript Submission and Tracking System
Publishing Ethics and Rectitude
Authorship
Author Benefits
Reviewer Guidelines
Guest Editor Guidelines
Peer Review Workflow
Quick Track Option
Copyediting Services
Bentham Open Membership
Bentham Open Advisory Board
Archiving Policies
Fabricating and Stating False Information
Post Publication Discussions and Corrections
Editorial Management
Advertise With Us
Funding Agencies
Rate List
Kudos
General FAQs
Special Fee Waivers and Discounts
- Contact
- Help
- About Us
- Search


The Open Atmospheric Science Journal
(Discontinued)
ISSN: 1874-2823 ― Volume 14, 2020
The Saharan Elevated Mixed Layer and its Aerosol Optical Depth
Toby N. Carlson*
Abstract
Schematic Skew-T soundings can be used to estimate the depth of elevated mixed layers and their origins thousands of kilometers downstream from their source regions. Focus is on the elevated mixed layer from the Sahara, the Saharan Air Layer (SAL), and its relationship to aerosol optical depth. Aerosol optical depth (AOD) measurements and SAL depth determined from atmospheric soundings were tabulated for five summers at three sites located downwind from the Sahara (Miami, Barbados and St. Cruz, Tenerife). These data are analyzed to show a site-specific relationship between the depth of the SAL and the AOD, the deeper the SAL the larger the AOD. The frequency distribution of SAL depths is also discussed.
Article Information

Identifiers and Pagination:
Year: 2016Volume: 10
First Page: 26
Last Page: 38
Publisher Id: TOASCJ-10-26
DOI: 10.2174/1874282301610010026
Article History:
Received Date: 25/05/2016Revision Received Date: 13/07/2016
Acceptance Date: 19/07/2016
Electronic publication date: 23/09/2016
Collection year: 2016
open-access license: This is an open access article licensed under the terms of the Creative Commons Attribution-Non-Commercial 4.0 International Public License (CC BY-NC 4.0) (https://creativecommons.org/licenses/by-nc/4.0/legalcode), which permits unrestricted, non-commercial use, distribution and reproduction in any medium, provided the work is properly cited.
* Address correspondence to this author at the Emeritus Department of Meteorology Penn State University, University Park, PA 16802, Pennsylvania, USA; Tel: 814-863-1582; E-mail: tnc@psu.edu
| Open Peer Review Details | |||
|---|---|---|---|
| Manuscript submitted on 25-05-2016 |
Original Manuscript | The Saharan Elevated Mixed Layer and its Aerosol Optical Depth | |
1. INTRODUCTION
All surface mixing layers contain some quantities of aerosol. Downstream from their source regions, mixing layers (characterized by their constant or slowly changing values of potential temperature, water vapor mixing ratio, and wind speed with height) become elevated. No longer in contact with the earth’s surface, the mixing layer is said to be an elevated mixed layer. The dynamics of this mixing layer (its growth and its transformation to an elevated layer) do not bear directly on the amount of dust being raised. That depends on the nature of the surface: the surface wind speed, roughness, friability, vegetation cover, and grain size. In addition, the potential temperature and water vapor content within the elevated mixed layer ultimately reflect on its dust content, its origin, and its duration in the atmosphere.
Much has been written about the transport of natural terrestrial aerosols, especially Saharan dust and the Saharan air layer (SAL) [1Alonzo-Perez S, Cuevas E, Querol X, Guerra JC, Perez C. African dust source regions for observed dust outbreaks over the Subtropical Eastern North Atlantic region, above 25 N. J Arid Environ 2012; 78: 100-9.
[http://dx.doi.org/10.1016/j.jaridenv.2011.11.013] , 2Prospero J, Collard F-X, Molinie J, Jeannot A. Characterizing the annual cycle of african dust transport to the caribbean basin and south america and its impact on air quality and the environment. Biogeochemical Cycles 2014; 28: 631-774.]. It is the purpose of this paper to show that the depth of the elevated SAL, as measured on atmospheric soundings downstream from the Sahara, is closely related to the total aerosol loading as measured by the aerosol optical depth (AOD). First, I present a discussion of how one can assess the presence of the Saharan dust layer on atmospheric soundings, in particular the way to estimate its base, top, and therefore, the depth of the Saharan air layer.
2. ATMOSPHERIC BOUNDARY LAYER GROWTH AND DUST
Growth of the atmospheric boundary layer begins with the turbulent flux of sensible heat from the surface. Incoming solar radiation absorbed at the ground is distributed back into the atmosphere as sensible and latent heat, the latter being in the form of evapotranspiration, and into the ground as sensible heat. The distribution of heat into each of these three categories is strongly controlled by the availability of surface water, the latter being converted to latent heat, and the thermal conductivity of the surface, which is also somewhat a function of soil wetness. Over a dry surface, most of the incoming solar radiation is distributed to the atmosphere as sensible heat. The reverse is true with respect to water vapor over moist surfaces.
To understand how to identify a mixed layer on a sounding, consider (Fig. 1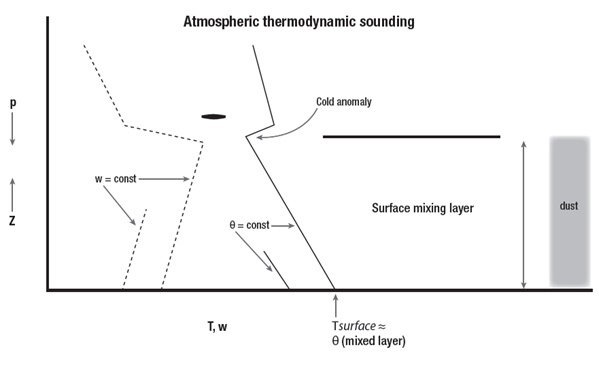 ), a schematic Skew-T Log P diagram, so called because the coordinates of temperature and moisture are not Cartesian with pressure but are skewed. Temperature (solid line; T) and water vapor mixing ratio, defined as the ratio of the mass of water vapor content to that of dry air (dashed lines; w), increase downward and toward the right, orthogonal to the lines of w while pressure p (height z) decreases (increases) vertically.

The turbulent flux of sensible heat from the surface produces a mixed layer, ideally with constant potential temperature θ and water vapor mixing ratio w. Lines of constant potential temperature on the sounding are referred to as adiabats because an air parcel, lifted or lowered without gain or loss of heat from the outside, will conserve its potential temperature (and water vapor mixing ratio) and remain with the same adiabatic value. Isopleths of potential temperature are illustrated on Fig. (1) by one schematic segment drawn dashed (and labeled accordingly as a line of constant θ) just to the left of the temperature sounding, sloping upward toward the left. Along these potential temperature lines, temperature itself decreases with decreasing pressure and increasing height at a rate (its lapse rate) very close to 10 ˚C per km. Potential temperature increases to the right orthogonal to the potential temperature adiabats.
Sensible heat flux into the atmosphere causes the formation of a mixing layer which warms and deepens with time during the day as more heat is added. The greater the heat flux, the more rapid the growth of the mixing layer. As Knippertz et al. point out [3Knippertz P, Ansmann A, Althausen D, et al. Dust mobilization and transport in the northern Sahara during SAMUM 2006- a meteorological overview. Tellus 2009; 61B: 12-31.
[http://dx.doi.org/10.1111/j.1600-0889.2008.00380.x] ], the lowest few tens or hundreds of meters near the surface tend to be superadiabatic (lapse rate greater than 10˚C per km) during hours when surface heating is occurring; this feature is shown on the right-hand panel of Fig. (3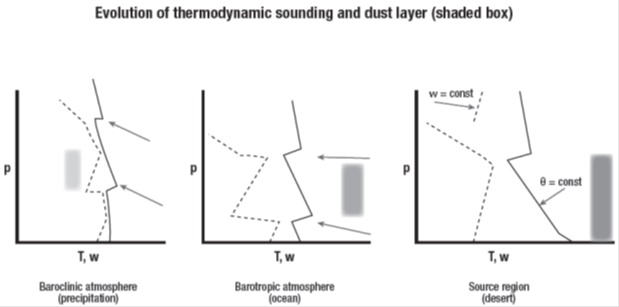 ). Generally, however, the temperature within the surface mixing layer lies along an adiabat all the way to the surface, as in Fig. (1), during periods of weak sensible heat flux, such as near sunset. In Fig. (1), the mixing layer of indeterminate depth is marked to its right with shading to indicate its probable dust content. Knippertz et al. [3Knippertz P, Ansmann A, Althausen D, et al. Dust mobilization and transport in the northern Sahara during SAMUM 2006- a meteorological overview. Tellus 2009; 61B: 12-31.
[http://dx.doi.org/10.1111/j.1600-0889.2008.00380.x] ] Fig. (6a ), Todd et al. [4Todd MC, Allen CJT, Bart M, et al. Meteorological and dust aerosol conditions over the western Saharan region observed at Fennec Supersite-2 during the intensive observation period in June 2011. J Geophys Res Atmos 2013; 118: 1-22.
[http://dx.doi.org/10.1002/jgrd.50470] ] Fig. (4a ), Engelstaedter et al. [5Engelstaedte S, Washington R, Flamanst C, Parker DJ, Allen CJ, Todd MC. The Saharan heat low and moisture transport pathways in the central Sahara—multi-aircraft observations and Africa_LAM evaluation. American Geophys Union 2015.] Fig. (6a), and Khan et al. [6Khan B, Stenchikov G, Weinzieri B, Kalenerski S, Osipov S. Dust plume formation in the free atmosphere and aerosol size distribution during the Saharan mineral dust experiment in North Africa. Tellus B Chem Phys Meterol 2015; 67: 1-22.
[http://dx.doi.org/10.3402/tellusb.v67.27170] ] Fig. (3) show this typical vertical distribution of potential temperature and water vapor mixing ratio similar to those shown in Fig. (1) in the mixing layer over Western Sahara.
As the mixing layer grows vertically, it intrudes into unmixed air from above that contains higher potential temperatures, a consequence of the inherent static stability of the atmosphere, wherein potential temperature generally increases with height. Accordingly, growth of the mixing layer is accompanied not only by upward heat flux from the surface but also a downward flux of heat from the more stable (higher θ) air above the mixing layer; the rate of downward heat flux, however, is always a small fraction (e.g., 20%) of the upward flux at the surface. Consequently, in accordance with the vertical divergence of heat flux near the top of the mixing layer, the atmosphere at those levels will always cool as the mixing layer grows. This process causes a temperature inversion (temperature increasing with height) to form at the top of the cool layer, which is often marked visually by a haze top. Wong et al. [7Wong S, Dressler AE, Mahowald NM, Yang P, Feng O. Maintenance of lower tropospheric temperature inversion in the Saharan Air Layer by dust and dry anomaly. J Clim 2009; 22: 5149-62.
[http://dx.doi.org/10.1175/2009JCLI2847.1] ] refer to this feature as the cold anomaly, marked accordingly in Fig. (1). Maximum warming is, of course, near the surface.
Because of the skewed coordinates of the Skew-T diagram, isopleths of constant mixing ratio (the dashed profile labeled w in Fig. (1)) slope upward toward the right. Values of w increase (to the right) or decrease (to the left) of the isopleths of w, which are shown by a single dashed line segment. Depending on the amount of water vapor flux from the ground, w may increase with time (values move to the right in the figure) due to surface evapotranspiration or decrease with time within the mixing layer due to the downward flux of drier air that accompanies the downward sensible heat flux from above the mixing layer. Like potential temperature, water vapor tends to become somewhat evenly mixed throughout the mixing layer, although generally far less uniformly so with height than potential temperature, its lack of uniformity being due, in part, to the downward flux of dry air at the top of the mixing layer, the small-scale patchiness of moisture, and the inherent instrumental lag in the sounding’s hygristor.
Mixing ratio and potential temperature, respectively, define dew point and kinematic temperature at a given pressure. These two distributions (kinetic temperature and dew point temperature) approach one another with height in the mixing layer, as can be seen in Fig. (1). Thus, as the mixing layer deepens during the day, the relative humidity at the top of the layer increases as the dew point and temperatures approach each other, while w at the surface may even decrease with time. Eventually, if the layer becomes sufficiently deep, saturation occurs at the top, resulting in the formation of cloud. The level at which saturation occurs is known as the mixing condensation level. The mixing condensation level is illustrated in Fig. (1) by the small elliptical blob just above the mixing layer, where the potential temperature and mixing ratio lines, if extended, would intersect. Todd et al. [4Todd MC, Allen CJT, Bart M, et al. Meteorological and dust aerosol conditions over the western Saharan region observed at Fennec Supersite-2 during the intensive observation period in June 2011. J Geophys Res Atmos 2013; 118: 1-22.
[http://dx.doi.org/10.1002/jgrd.50470] ] Fig. (4a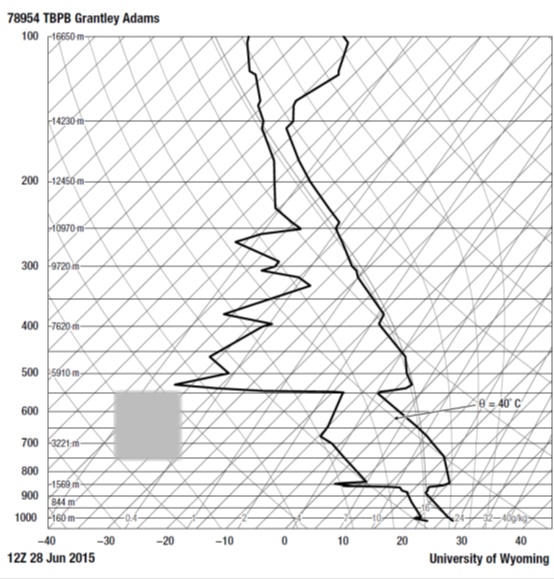 ) shows examples of soundings with deep mixing layers that are saturated at the top. In such cases, when the mixing condensation level is reached, the mixing layer will often be capped by small puffy clouds with turrets, known as alto cumulus castellanus. This feature is illustrated in Fig. (2
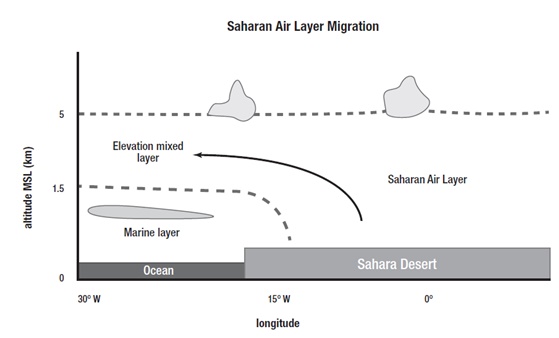 ).
).
 |
Fig. (2) Schematic cross section approximately along latitude 15 degrees north from the western Sahara to the Atlantic Ocean, showing the Saharan Air Layer (SAL) moving from the desert over the cooler marine boundary layer where it appears as an elevated mixed layer. Clouds form at the top of the marine boundary layer (stratocumulus) and at the top of the SAL (alto cumulus castellatus) are indicated; (based on a figure by Cuesta et al. [18Cuesta J, Marsham JH, Parker DJ, Flamant C. Dynamical mechanisms controlling the vertical redistribution of dust and the thermodynamic structure of the West Saharan atmospheric boundary layer during summer. Atmos Sci Lett 2009; 10: 34-42. [http://dx.doi.org/10.1002/asl.207] ]). |
Mixing layers can also reach condensation if they are lifted by some dynamical process, to be discussed below. In that case, further ascent would no longer be along a dry adiabatic, due to release of the latent heat of condensation, but a lower rate of cooling with height, i.e., a deviation to the right of the lines of constant θ with increasing height.
3. TAGGING THE DUST LAYER
A mixing layer can be assigned labels, the value of its potential temperature θ and water vapor mixing ratio w. According to its definition, potential temperature is the temperature that the air would have if lowered (or lifted) adiabatically (i.e., along a dry adiabat) to a reference level, that being defined by convention as 1000 mb, which is a pressure very close to the surface when the latter is near sea level. If the base of the mixing layer is at the surface, and therefore close to the 1000 mb level, the potential temperature will be close to the surface temperature when the shallow superadiabatic layer created by surface heating is absent, typically near sundown. Thus, the surface temperature (and surface mixing ratio) is often a good indication of the value of potential temperature in the mixing layer, at least near sundown.
4. ELEVATED MIXED LAYERS
Mixing layers inevitably move away from their source regions. When a mixing layer finds itself no longer in turbulent contact with the surface (aside from the usual nocturnal cooling effect), it becomes an elevated mixed layer. Jury and Whitehall [8Jury MR, Whitehall K. Warming of an elevated layer over Africa. Clim Change 2010; 99: 229-45.
[http://dx.doi.org/10.1007/s10584-009-9657-4] ] refer to this as an elevated warm layer although it is both warmer (at the base) and colder than its surroundings (near the top). As such, it will still possess its conservative properties acquired over the source region, potential temperature, and mixing ratio.
Mixing layers may become elevated, detached from their surface source of heat and moisture, for one of two reasons: (1) the layer may have been lifted by shallow or deep dynamical processes within the atmosphere; (2) its source region is an elevated plateau, such as Mexico and United States Southwestern desert area or the interior of Spain. In this case, the mixing layer slides off the plateau and caps a surface mixing layer below which may have a very different potential temperature and mixing ratio from that above [9Carlson TN. Mid Latitude Weather Systems. US: American Meteorological Society 1991.], but will not experience ascent in its top as long as the horizontal temperature gradient remains weak. In either case, the base of the elevated mixed layer tends to form a strong inversion beneath it. As noted by Jury and Whitehall [8Jury MR, Whitehall K. Warming of an elevated layer over Africa. Clim Change 2010; 99: 229-45.
[http://dx.doi.org/10.1007/s10584-009-9657-4] ], this inversion can suppress convective cloud formation whereby the usual trade cumulus become flattened to stratocumulus, as suggested in Fig. (2) .
 |
Fig. (3) Sequence of three thermodynamic soundings with notation similar to Fig. (1 ). Right side; sounding identical to Fig. (1) for a location over Western Sahara. Center; elevated Saharan mixed layer sounding for a location over the tropical Atlantic Ocean, showing the dust layer overlying the shallow marine boundary layer. The SAL base has been lifted but the top remains unaffected, as shown by the arrows. Left side; the layers in the center figure have experienced dynamic lifting at all levels -- (indicated by the arrows) -- upon encountering a baroclinic region: – a zone of deep horizontal temperature gradient. This results in extensive saturation at various levels and a decreased SAL depth due to condensation. Shading suggests relative concentration of dust in the SAL. |
Dynamic lifting of atmospheric layers, including elevated mixed layers, occurs when the layer encounters a region of significant horizontal temperature gradient (a “baroclinic” zone), such as a temperature front. As an example, consider how the SAL in Fig. (2 ) illustrates lifting of the SAL base along the coast of West Africa, where a very strong but shallow temperature gradient exists between desert and ocean. The figure shows that the SAL moves westward where its base lifts over the much cooler marine boundary layer, forming an inversion typically between 1 and 2 km above the ocean surface. The marine boundary layer below also has its own characteristic potential temperature and water vapor mixing ratio, as shown in the middle panel of Fig. (3) , but with a much lower potential temperature (typically that close to the sea surface temperature, say 22˚C) and higher mixing ratio. In contrast, the warm SAL, whose potential temperature during the summer months is typically about 43˚C above the interior of the continent, forms a very strong inversion at the top of the marine mixing layer, at the base of which potential temperature increases by up to 20˚C within a vertical distance of a few hundred meters.
The progress of the SAL from mixing layer to elevated mixed layer, illustrated by the two panels on the right side of Fig. (3) , occurs abruptly just inland along the African coast. On the far right is the surface mixing layer sounding for the Saharan Air sounding, essentially that in Fig. (1) . To its left is the sounding that would appear when the SAL is no longer a surface mixing layer but an elevated mixed layer above the marine boundary layer (illustrated in Fig. (2)) west of the African continent. Values of potential temperature and mixing ratio within the SAL are approximately conserved, possessing similar values to those within the mixing layer over the continent. Likewise, the elevated mixed layer would contain much of the original aerosol content, albeit being continuously depleted by fallout over the ocean.

Whereas the base of the SAL is lifted along the African coast, Fig. (2) shows that the top of the dust layer remains approximately at the same level over the tropical Atlantic as over Africa, although some descent of the top seems to occur in response to large-scale sinking motion characteristic of these latitudes; this aspect is discussed in a later section of this paper. Subsequent movement of the SAL proceeds without much change in structure as long as the atmosphere remains essentially barotropic (no horizontal temperature gradient) typical at tropical latitudes and does not encounter a region of cumulus convection.
Fig. (3) schematically illustrates the dust layer with shading; its relative concentrations are suggested by the density of the shading, which become lighter as the layer moves across the Atlantic. Dust concentrations are much higher in the elevated mixed layer than near the surface beneath it [7Wong S, Dressler AE, Mahowald NM, Yang P, Feng O. Maintenance of lower tropospheric temperature inversion in the Saharan Air Layer by dust and dry anomaly. J Clim 2009; 22: 5149-62.
[http://dx.doi.org/10.1175/2009JCLI2847.1] ], the isentropic layer forming an essentially continuous duct for the dust to travel.
Whereas the SAL generally moves westward across the tropical Atlantic and also intermittently northward near the African coast [2Prospero J, Collard F-X, Molinie J, Jeannot A. Characterizing the annual cycle of african dust transport to the caribbean basin and south america and its impact on air quality and the environment. Biogeochemical Cycles 2014; 28: 631-774.] (Figs. 1 and 5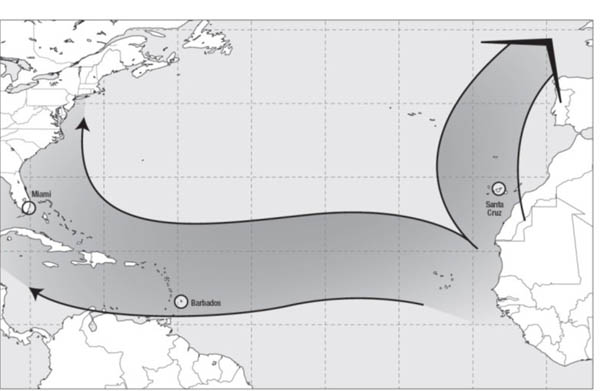 ) the marine layer beneath the SAL generally flows from the northeast, undercutting the elevated SAL and bringing dust seeded from above southward, and ultimately into the intertropical convergence zone where it encounters convection and rainout. High dust concentrations are frequently measured at the surface beneath the elevated Saharan nixed layer, even as far west as Miami [2Prospero J, Collard F-X, Molinie J, Jeannot A. Characterizing the annual cycle of african dust transport to the caribbean basin and south america and its impact on air quality and the environment. Biogeochemical Cycles 2014; 28: 631-774.].
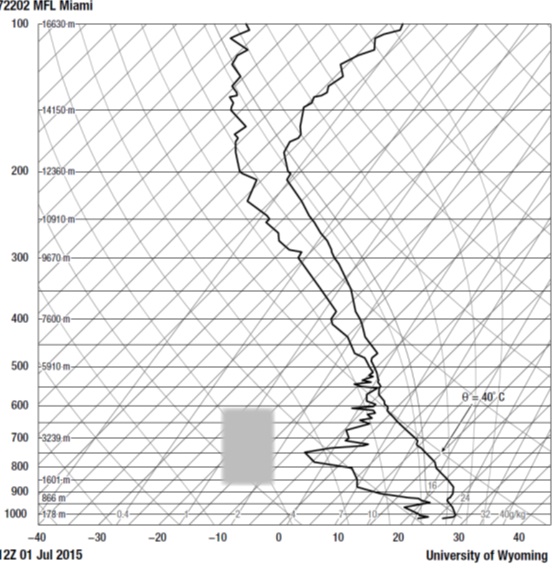 |
Fig. (4b) Same as Fig. (4a ) but for Miami on 1 July 2015, showing the layer of nearly constant potential temperature (slightly less than 40˚C) and mixing ratio (about 4 gkg-1 ) with height over a deep layer from 600 to 875 mb.
|
5. DEMISE OF THE DUST LAYER
Because of the barotropic nature of the tropical atmosphere, it is not uncommon, therefore, to find a deep elevated SAL on soundings thousands of kilometers downwind of the Sahara: over the Caribbean and even over Miami [10Carlson TN, Prospero JM. The large-scale movement of saharan air outbreaks over the northern equatorial atlantic. J Appl Meteorol 1972; 11: 283-97.
[http://dx.doi.org/10.1175/1520-0450(1972)011<0283:TLSMOS>2.0.CO;2] -13Prospero JM. Characterizing the temporal variability of African dust over the Atlantic. Science Highlights. Dust 2014; 2013; 22(2): 68-9.]. When encountering a region with a horizontal temperature gradient, however, dynamical processes produce ascent and the formation of cloud, first near the top of the SAL and eventually rainout of the dust particles. This is illustrated on the left hand sounding in Fig. (3), whereby large-scale lifting throughout the column results in the sounding becoming saturated (the moisture and potential temperature profiles merging), destroying its original isentropic character. A small fragment of the original isentropic layer is still shown in Fig. (3) , with a suggestion that the remaining SAL may still contain some aerosol.
6. SOME ILLUSTRATIONS
Two atmospheric soundings made during a heavy dust outbreak in 2015 are presented, one for Barbados and one for Miami. Fig. (4a) is an atmospheric sounding at Barbados on June 28, 2015, when the aerosol optical depth at 500nm was 0.41 and the SAL extended from 750 to 550 mb. There the potential temperature within the SAL was about 40.5˚C with a mixing ratio of about 3 g kg-1 in the upper part of the mixed layer and about 5 g kg-1 in its lower part. Three days later on July 1, the same dust outbreak was reaching Miami (Fig. 4b ). There, the SAL appears more uniformly mixed than at Barbados. The optical depth at 500 nm was 0.35 and the potential temperature in the mixed layer was about 39˚C, with a mixing ratio of close to 5 g kg-1. Mixing ratio within the elevated mixed layer exhibits the characteristic constancy with height and the depth is actually deeper than at Barbados (Fig. 4a) .
7. SAL DEPTH AND AEROSOL OPTICAL DEPTH
In order to test the hypothesis that SAL depth and AOD are related, higher values of one corresponding to higher values of the other, SAL depth and AOD at 500 nm were tabulated for three sites downwind from West Africa, these being Miami, FL; Barbados, WI; and St Cruz, Tenerife (Fig. 5). AOD measurements made at the three sites shown in Fig. (5) were made as part of NASA’s program of automated robotic network of sun photometers, wherein data is measured automatically throughout the hours of sunlight at a variety of different wavelengths. Values were tabulated from the partially cloud screened level 1.5 data for the 500 nm channel. One measurement was extracted on each day for the time closest to 1200 GMT for each of months May–August for the years 2011–2015.
SAL depths were extracted by inspection of the 1200 GMT Skew-T soundings published by the University of Wyoming. Extracting a SAL depth from sounding is admittedly somewhat of a subjective operation. In most cases, the presence of a SAL was clear (as in Figs. (4a and 4b) which resemble the middle part of schematic (Fig. 3). Criteria for the SAL are (1) an essentially isentropic layer bounded by a sharp inversion at the bottom and often at the top, and (2) a slowly changing mixing ratio with height within the SAL which decreases rapidly just above the isentropic layer. Often, however, the upper inversion was not present due to the layer being saturated, as in Miami sounding (Fig. 4b), which shows a deep SAL from 550 mb to about 875 mb, topped by a saturated layer.
 |
Fig. (5) Three sites (Miami, Barbados, and St. Cruz) for which AOD and SAL depth measurements were tabulated. The figure shows schematically the preferred paths for the Saharan dust plumes. |
AOD and SAL depth were recorded only for days in which the data appeared suitable and both AOD measurements and Skew-T soundings were available. Some months and even years were missing from the records, such as the AOD data for the latter two years at St. Cruz. Many days, of course, had no SAL but were still recorded as having no SAL if an AOD measurement was also available. I eliminated all sounding data for Miami with a westerly wind component that might be indicating a trajectory from the continent. Only 54 days out of 224 processed were recorded as having a SAL at Miami. Fig. (6a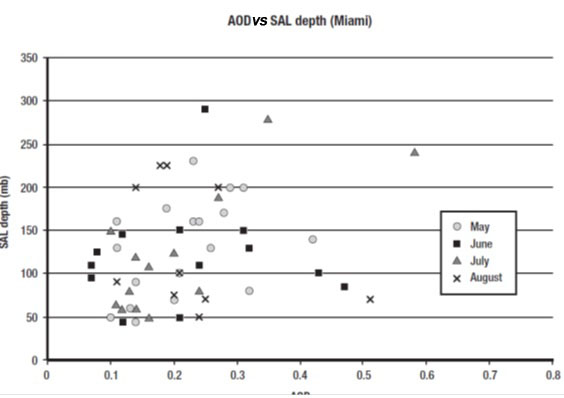 ) is a plot of AOD versus SAL depth for these 54 days, coded by month. Although the linear correlation coefficient (R2) was poor (~ 0.08) for this data distribution, it is much higher for July than the other months, suggesting some relationship exists between SAL depth and AOD.
Barbados shows much more consistency in the AOD-SAL relationship than at Miami. Based on 195 SAL observations, the plot of SAL depth versus AOD for this site has larger R2 (~ 0.3) (Fig. 6b ). Only 71 days showed no SAL present. The winds at Barbados were almost always easterly and often moderately strong during periods of heavy dust.
 |
Fig. (6a) AOD versus SAL depth by month for Miami. |
St. Cruz (Fig. 6c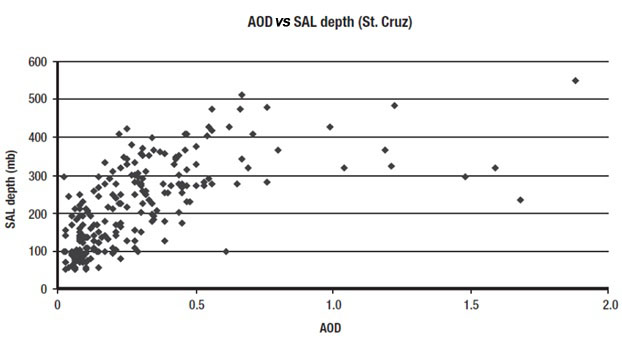 ) showed the most consistent distribution (R2 ~ 0.5, exponential fit) for 212 SAL observations, compared with 209 days for which no SAL was present. Virtually all Skew T soundings reported southerly or southwesterly winds at the level of the SAL, in accordance with the trajectory of the dust plume suggested in Fig. (5).
Various reasons exist for the poor correlations, such as in the case of Miami. Besides the natural variability of the atmosphere, the subjectivity in defining a SAL and its depth, the AOD measures the total optical depth in a vertical column, whereas the SAL is just one layer in the sounding. A considerable amount of dust resides in the surface layers beneath the SAL at Barbados and Miami, although most of the dust still remains in the SAL.
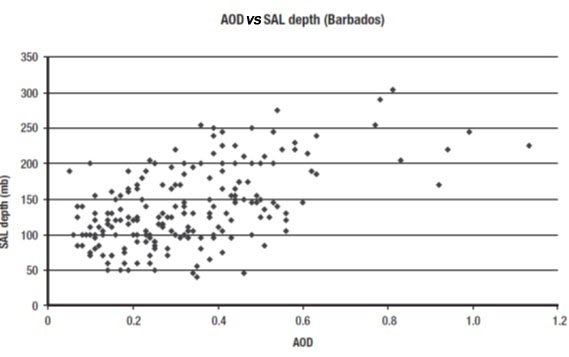 |
Fig. (6b) SAL depth versus AOD for Barbados. |
In order to reduce the natural atmospheric variability, AOD measurements were divided into intervals of essentially 50 mb of SAL depth, 1-49 mb, 50-99 mb, 100-159 mb, etc. AOD and the SAL depths in each of those 50 mb intervals were averaged. These results showed a very close correspondence between SAL depth and AOD. Fig. (7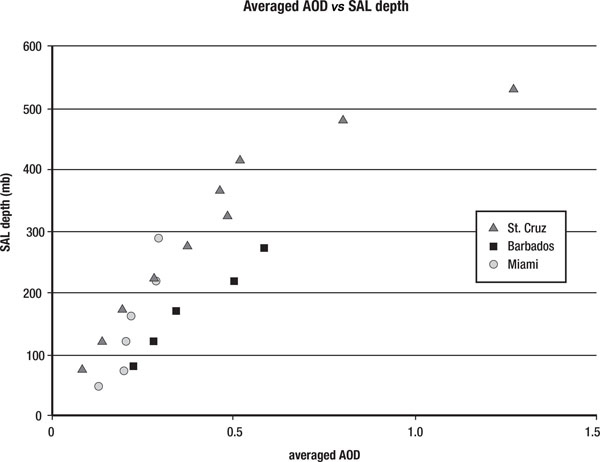 ) shows averaged AOD and SAL depths for all three sites with R-squared values for the three sites of 0.9 or better. All of the smoothed distributions show very small values of the AOD when extrapolated to zero SAL depth, suggesting that virtually all the dust present at these station came from Africa.
 |
Fig. (6c) SAL depth versus AOD for St. Cruz. |
 |
Fig. (7) Averaged AOD versus SAL depth for the three sites. |
Not surprisingly, Miami values of AOD in Fig. (7) were about half those of Barbados. This is in accordance with Prospero and Mayol-Bracero [12Prospero JM, Mayol-Bracero O. Understanding the transport and impact of African dust on the Caribbean basin. Bull Amer Met Soc 2013; 94: 1329-35.
[http://dx.doi.org/10.1175/BAMS-D-12-00142.1] ], who show that the mineral dust concentrations at Miami are about one-third to one-half those at Barbados, with a slight lag of a couple days between their maximum values. St. Cruz experienced the deepest SAL depths, many exceeding 400 mb. It was somewhat surprising, therefore that, despite the much shorter transport time between Africa and St. Cruz, as compared with that from Africa to Barbados or Miami, the AOD values at St. Cruz were not much different from those at Miami and less than those at Barbados for SAL depths below 300 mb. Maring et al. [14Maring H, Savoie DL, Izaguirre MA, Custals L. Mineral dust aerosol size distribution change during atmospheric transport. J Geophys Res 2003; 108: 8592.
[http://dx.doi.org/10.1029/2002JD002536] ] show that the size distribution of particles at Puerto Rico, about half way between Barbados and Miami, is similar to that at St. Cruz, but with many fewer large particles (in excess of 7 microns).
8. MEAN PROPERTIES OF THE SAL
Miami experienced the fewest days with SAL as compared with the other two sites (Fig. 8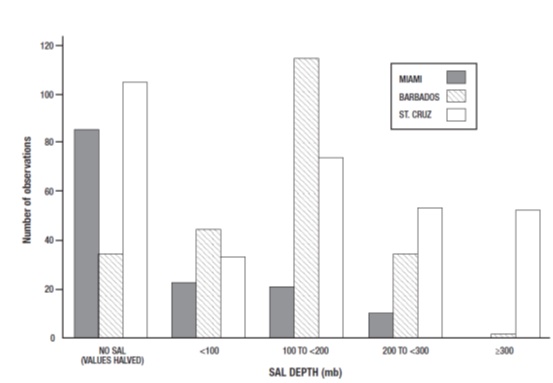 ). Both Miami and St. Cruz had a majority of days with no SAL. In the former, SAL depths were generally below 200 mb depth. Barbados experienced the most persistent SAL, with a high predominance of depths between 100 and 200mb. SAL depths for Santa Cruz were more widely distributed, especially toward the higher end of the spectrum; two instances occurred when SAL depths at St Cruz were 500 mb or above with a top at 400 mb, about 7 km elevation! These extreme depths were almost always associated with high values of AOD and the presence of saturation or near saturation at the top.
 |
Fig. (8) Histogram for the three sites showing frequency of SAL depth observations in different depth intervals. |
Based on years of my observing the movement of dust streams over the tropical Atlantic, I estimate that it takes about six days for the dust to move from Africa to Barbados and another 2–3 days to reach Miami. It should be understood, as can be seen in Fig. (5), that dust reaching Barbados and Miami are not the same as that reaching St. Cruz. Dust, along with their attendant water vapor and carbon dioxide, are grey bodies, emitting some long wave radiation to space, which I estimate to correspond to a radiative cooling rate of about 0.5˚ C day-1in the dust layer. This cooling rate is consistent with an initial potential temperature within the SAL over Africa of about 43˚ C in summertime, in the mean about 3˚C warmer than at Barbados Table 1 [4Todd MC, Allen CJT, Bart M, et al. Meteorological and dust aerosol conditions over the western Saharan region observed at Fennec Supersite-2 during the intensive observation period in June 2011. J Geophys Res Atmos 2013; 118: 1-22.
[http://dx.doi.org/10.1002/jgrd.50470] , 15Carlson TN, Ludlam FH. Conditions for the occurrence of severe local storms. Tellus 1968; XX: 203-26.
[http://dx.doi.org/10.1111/j.2153-3490.1968.tb00364.x] ]. Mean temperatures at Barbados and Miami shown in Table 1, respectively as 40.5 and 39.3 °C, reflect the cooling with time that occurs throughout the SAL as it moves across the tropical Atlantic and Caribbean, Accordingly, the mean potential temperature in the SAL at St. Cruz (41.2 °C) would imply about a 3 ½ day travel time for the dust between Africa and St. Cruz. This is approximately half the time for dust to reach the Caribbean, if it were to start over Africa in a mixing layer with a potential temperature of 43° C. Water vapor mixing ratio also tends to be conserved within the SAL during its movement westward (and northward), with typical values of 3-5 g kg-1, equivalent to a relative humidity at the surface over the Sahara of 5–10%.
Given the implied descent of 17 mb between Barbados and Miami in Table 1, the implied descent rate would be about 7 mb per day (less than 0.1 cm s-1), which is reasonable for the gentle descending branch of the Hadley cell. Based on this descent rate and the values shown in Table 1, the mean SAL top upon leaving Africa would have been about 572 mb, in accordance with estimates of the SAL top over Africa made by Tsamalis et al. [16Tsamalis C, Chedin A, Pelon J, Chapelle V. The seasonal vertical distribution of the Saharan Air Layer and its modulation by the wind. Atmos Chem Phys 2013; 13: 11235-57.
[http://dx.doi.org/10.5194/acp-13-11235-2013] ]. Clearly, however, SAL depths can exceed this altitude frequently at St. Cruz Fig. (8). Tsamalis et al. [16Tsamalis C, Chedin A, Pelon J, Chapelle V. The seasonal vertical distribution of the Saharan Air Layer and its modulation by the wind. Atmos Chem Phys 2013; 13: 11235-57.
[http://dx.doi.org/10.5194/acp-13-11235-2013] ] prescribe a much more precipitous descent of the SAL.
Tsamalis et al. however, do show that Saharan dust is carried in one layer, which is the SAL. Aircraft observations always tend to show far more dust concentrated within the SAL than below it and that the haze layer extends throughout the SAL, even as far west as Miami, indicating that the dust is being constantly circulated within the SAL (rather than the particles all subsiding uniformly by gravity to the bottom of the SAL or below). This recirculation of the aerosol occurs because the low static stability (nearly isentropic lapse rate) within the SAL promotes continuous, if weak, turbulent mixing. Maring et al. [14Maring H, Savoie DL, Izaguirre MA, Custals L. Mineral dust aerosol size distribution change during atmospheric transport. J Geophys Res 2003; 108: 8592.
[http://dx.doi.org/10.1029/2002JD002536] ] account for this effect by introducing an artificial ascending velocity in their aerosol model to successfully predict that particle size distribution of the dust reaching Puerto Rico.
10. ELEVATED MIXED LAYERS IN OTHER REGIONS
Elevated mixed layers appear in many parts of the world. Potential temperatures in elevated mixed layer in excess of 40˚C with origins over Mexico and the southwest of the United States are found quite often over the lower Great Plains and Ohio Valley in springtime. They are also found over France and southern England with values of about 36˚C, characteristic of the summertime surface mixing layer over the Meseta, the Spanish plateau [15Carlson TN, Ludlam FH. Conditions for the occurrence of severe local storms. Tellus 1968; XX: 203-26.
[http://dx.doi.org/10.1111/j.2153-3490.1968.tb00364.x] ].
Many sources of mineral dust other than the Sahara exist in other locations, as shown in Fig. (1) of Gonzales-Martin et al. [17Gonzales-Martin C, Perez NT, Valladares B, Griffin DW. The global dispersion of pathogenic microorganisms by dust storms and its relevance to agriculture. Adv Agron 2014; 127: 1-41.
[http://dx.doi.org/10.1016/B978-0-12-800131-8.00001-7] ]. I have seen atmospheric soundings made over the Arabian Sea during the MONEX (1980) experiment exhibiting deep elevated mixed layers with potential temperatures in excess of 40˚C. Their origins are almost certainly over Saudi Arabia and surrounding desert areas, possibly including northern India. Similar soundings exist along the coast of Australia where warm and deep elevated mixing layers come from that continent’s desert interior. Other regions downwind from dry areas, such as China (the Gobi Desert) and southern Africa (the Kalahari Desert) produce quantities of dust [17Gonzales-Martin C, Perez NT, Valladares B, Griffin DW. The global dispersion of pathogenic microorganisms by dust storms and its relevance to agriculture. Adv Agron 2014; 127: 1-41.
[http://dx.doi.org/10.1016/B978-0-12-800131-8.00001-7] ], undoubtedly accompanied by their signature elevated mixed layers as shown.
Even relatively vegetated and well-watered regions produce their own, albeit shallower and cooler, mixing layers with their reduced dust loading; (the reader should note the likely presence of the marine mixing layer beneath the SAL dust layer in Figs. (4a and b). Sometimes multiple elevated mixed layers can be found downwind of multiple source regions. In any case the mixing layer originating in a specific region would have its own characteristics of potential temperature, water vapor mixing ratio and dust content appropriate to its source region.
DISCUSSION
In order to test the hypothesis that SAL depth and aerosol optical depth at 500 nm are intimately related, the top, base, depth and potential temperature of the SAL were tabulated for three stations: Miami, Florida; Barbados, WI; and St. Cruz, Tenerife; for the four months, May–August over a five year period 2011–2015. Raw plots of AOD versus SAL depth for this 20-month period showed considerable scatter, but with a relationship clearly evident (AOD increasing with increasing SAL depth). However, when the data was averaged over 50 mb intervals of SAL depth, a very close relationship was found for all three sites (Fig. 7). Barbados and Miami showed similar behavior with the latter having AOD values about one-half the former. Both sites experienced depths virtually all less than 300 mb. St. Cruz, however, showed a relationship similar to that of Miami up to 300 mb, but with many instances of much larger SAL depths (up to 550 mb) with much higher values of AOD at the larger depths than measured at either Miami or Barbados.
Curves shown in Fig. (7) are all virtually linear with pressure (height) except for St. Cruz at depths above 300 mb. This means that the AOD would be the same in every vertical depth interval, implying that the dust concentration, in the mean, would be constant with height within the SA with each vertical segment being essentially similar.
Some interesting questions arise from the results of this paper. That the very deep SAL layers found at St. Cruz never seem to appear at Barbados is somewhat puzzling, as subsidence is far too gentle to explain the lack of SAL depths greater than 300 mb in the Caribbean. Such deep SAL mixed layer rarely appear along the African coast at Dakar, although they are not infrequently observed in the middle of the Saharan desert. Why the values of AOD should be so low with the lower SAL depths at St. Cruz, but are so large in the greater depth category is not evident. And why, despite its shorter trajectory reaching St. Cruz, is the size distribution at that location so similar to that reaching the Caribbean, twice the distance or more from St. Cruz [14Maring H, Savoie DL, Izaguirre MA, Custals L. Mineral dust aerosol size distribution change during atmospheric transport. J Geophys Res 2003; 108: 8592.
[http://dx.doi.org/10.1029/2002JD002536] ]. It is possible, as further suggested in Fig. (5), that dust reaching St. Cruz originates from a more northerly, desert location than the dust reaching Barbados, and therefore the former might contain an initially deeper SAL and a larger fraction of large desert, quartz-like, particles that would fall out before reaching St. Cruz, leaving the size spectrum of particles similar to that measured in the Caribbean.
CONFLICT OF INTEREST
The authors confirm that this article content has no conflict of interest.
ACKNOWLEDGEMENTS
I would like to thank Joe Prospero for his help in finding the appropriate data for this paper. I am grateful to Roy Greenfield who was kind enough to read through the manuscript and offer suggestions. I am also grateful to my illustrator, Erin Greb, who produced or modified most of the figures and to Amanda Richards for her diligent editorial help.
REFERENCES
| [1] | Alonzo-Perez S, Cuevas E, Querol X, Guerra JC, Perez C. African dust source regions for observed dust outbreaks over the Subtropical Eastern North Atlantic region, above 25 N. J Arid Environ 2012; 78: 100-9. [http://dx.doi.org/10.1016/j.jaridenv.2011.11.013] |
| [2] | Prospero J, Collard F-X, Molinie J, Jeannot A. Characterizing the annual cycle of african dust transport to the caribbean basin and south america and its impact on air quality and the environment. Biogeochemical Cycles 2014; 28: 631-774. |
| [3] | Knippertz P, Ansmann A, Althausen D, et al. Dust mobilization and transport in the northern Sahara during SAMUM 2006- a meteorological overview. Tellus 2009; 61B: 12-31. [http://dx.doi.org/10.1111/j.1600-0889.2008.00380.x] |
| [4] | Todd MC, Allen CJT, Bart M, et al. Meteorological and dust aerosol conditions over the western Saharan region observed at Fennec Supersite-2 during the intensive observation period in June 2011. J Geophys Res Atmos 2013; 118: 1-22. [http://dx.doi.org/10.1002/jgrd.50470] |
| [5] | Engelstaedte S, Washington R, Flamanst C, Parker DJ, Allen CJ, Todd MC. The Saharan heat low and moisture transport pathways in the central Sahara—multi-aircraft observations and Africa_LAM evaluation. American Geophys Union 2015. |
| [6] | Khan B, Stenchikov G, Weinzieri B, Kalenerski S, Osipov S. Dust plume formation in the free atmosphere and aerosol size distribution during the Saharan mineral dust experiment in North Africa. Tellus B Chem Phys Meterol 2015; 67: 1-22. [http://dx.doi.org/10.3402/tellusb.v67.27170] |
| [7] | Wong S, Dressler AE, Mahowald NM, Yang P, Feng O. Maintenance of lower tropospheric temperature inversion in the Saharan Air Layer by dust and dry anomaly. J Clim 2009; 22: 5149-62. [http://dx.doi.org/10.1175/2009JCLI2847.1] |
| [8] | Jury MR, Whitehall K. Warming of an elevated layer over Africa. Clim Change 2010; 99: 229-45. [http://dx.doi.org/10.1007/s10584-009-9657-4] |
| [9] | Carlson TN. Mid Latitude Weather Systems. US: American Meteorological Society 1991. |
| [10] | Carlson TN, Prospero JM. The large-scale movement of saharan air outbreaks over the northern equatorial atlantic. J Appl Meteorol 1972; 11: 283-97. [http://dx.doi.org/10.1175/1520-0450(1972)011<0283:TLSMOS>2.0.CO;2] |
| [11] | Prospero JM. Long-term measurements of the transport of African mineral dust to the southeastern United States: Implications for regional air quality. J Geophys Res 1999; 104: 15917-27. [http://dx.doi.org/10.1029/1999JD900072] |
| [12] | Prospero JM, Mayol-Bracero O. Understanding the transport and impact of African dust on the Caribbean basin. Bull Amer Met Soc 2013; 94: 1329-35. [http://dx.doi.org/10.1175/BAMS-D-12-00142.1] |
| [13] | Prospero JM. Characterizing the temporal variability of African dust over the Atlantic. Science Highlights. Dust 2014; 2013; 22(2): 68-9. |
| [14] | Maring H, Savoie DL, Izaguirre MA, Custals L. Mineral dust aerosol size distribution change during atmospheric transport. J Geophys Res 2003; 108: 8592. [http://dx.doi.org/10.1029/2002JD002536] |
| [15] | Carlson TN, Ludlam FH. Conditions for the occurrence of severe local storms. Tellus 1968; XX: 203-26. [http://dx.doi.org/10.1111/j.2153-3490.1968.tb00364.x] |
| [16] | Tsamalis C, Chedin A, Pelon J, Chapelle V. The seasonal vertical distribution of the Saharan Air Layer and its modulation by the wind. Atmos Chem Phys 2013; 13: 11235-57. [http://dx.doi.org/10.5194/acp-13-11235-2013] |
| [17] | Gonzales-Martin C, Perez NT, Valladares B, Griffin DW. The global dispersion of pathogenic microorganisms by dust storms and its relevance to agriculture. Adv Agron 2014; 127: 1-41. [http://dx.doi.org/10.1016/B978-0-12-800131-8.00001-7] |
| [18] | Cuesta J, Marsham JH, Parker DJ, Flamant C. Dynamical mechanisms controlling the vertical redistribution of dust and the thermodynamic structure of the West Saharan atmospheric boundary layer during summer. Atmos Sci Lett 2009; 10: 34-42. [http://dx.doi.org/10.1002/asl.207] |