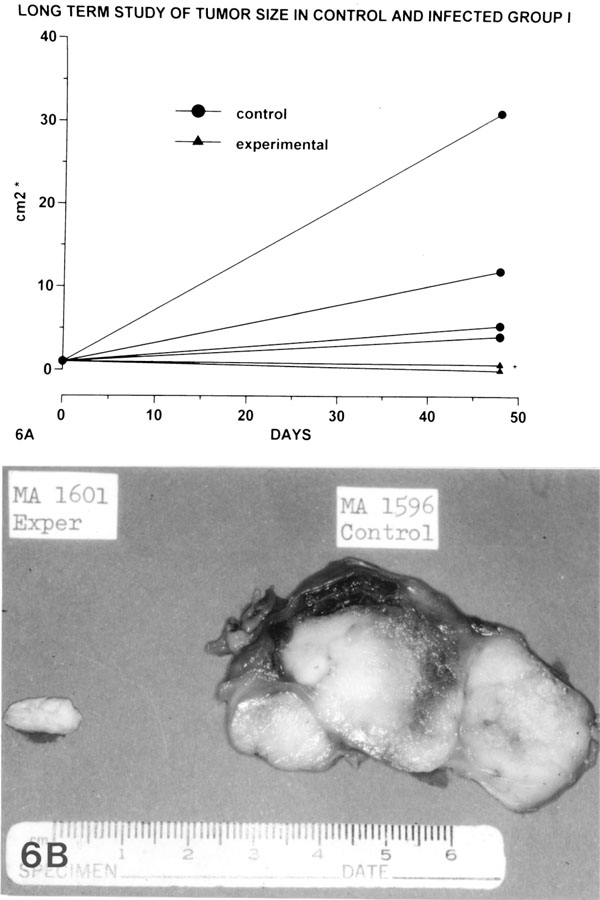
Fig. (6) In the first group of the long-term study (48 days), the tumors show variances of the size of the controls ranging from 4.1 cm2 to
31.2 cm2 (average: 13.17 cm2; sd: 12.50 cm2), while the infected tumors measuring from 0 to 0.7 cm2 (average: 0.52 cm2; sd: 0.35 cm2) (A).
The infected tumor on the left side as compared with the control on the right side. The treated tumor is small and necrotic, while the control
is massive and firm (B).