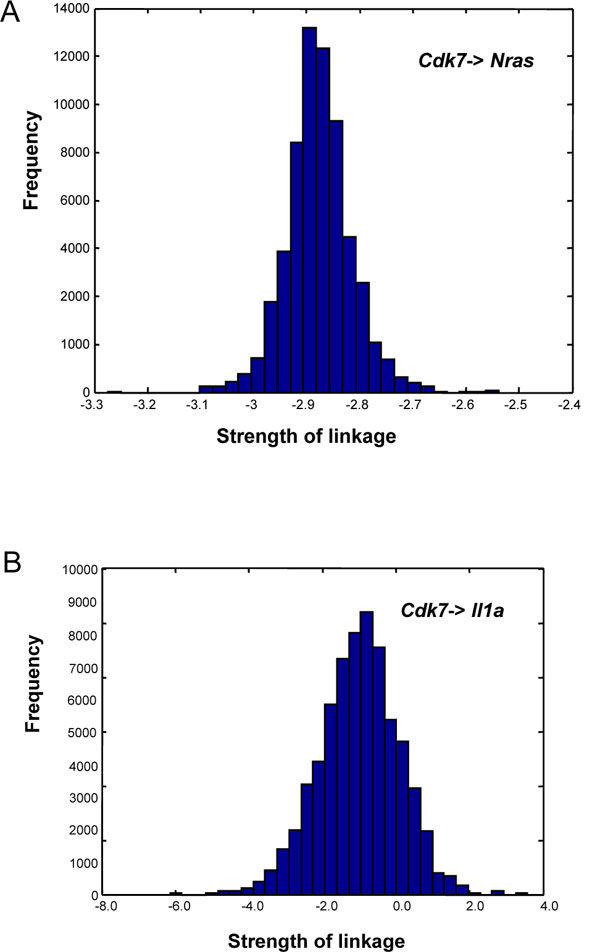
Fig. (4) (A, B) Frequency histograms approximating the posterior
distributions for linkages from Cdk7 to Nras (a statistically
significant downregulation) and Cdk7 to Il1a (marginally
significant downregulation). Histograms were derived by Bayesian
analysis of the gene interaction network shown in Fig. (2C) using
70,000 out of 140,000 Markov-Chain Monte Carlo samples and
prior distributions as shown in Table 4.