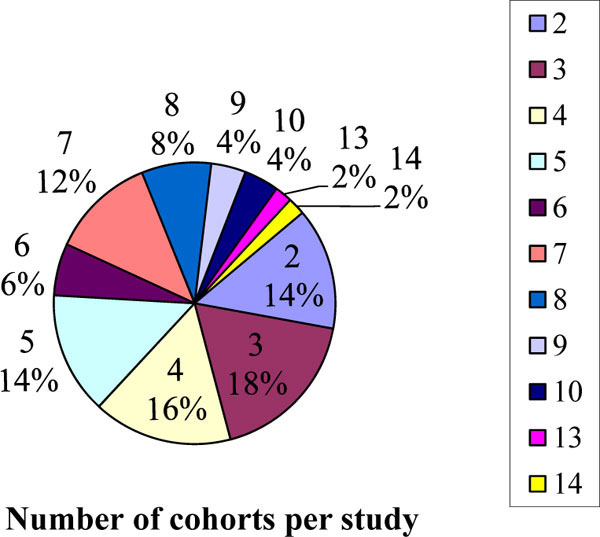
Fig. (3)
Pie chart showing the number of cohorts per study surveyed.