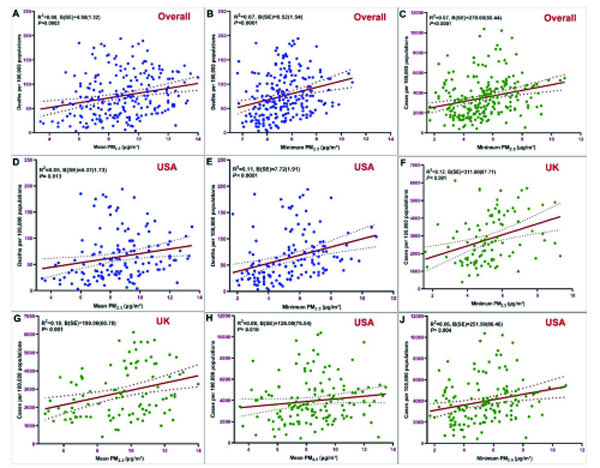
Fig. (1)
Scatter plots show standardized coefficients of linear regression model between COVID-19 and PM2.5 parameter in UK and USA cities. Cases (green bullets) and deaths (blue bullets) per 100,000 populations were positively associated with PM2.5 in study cities. Green and blue points=mean COVID-19 value for each city, B=unstandardized coefficient, SE=standard error.