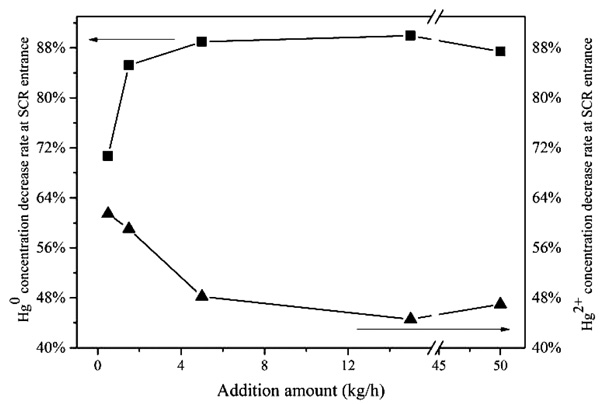
Fig. (3)
Variation of Hg
0
and Hg
2+
concentration decrease rate at SCR entrance versus CaBr
2
addition amount.