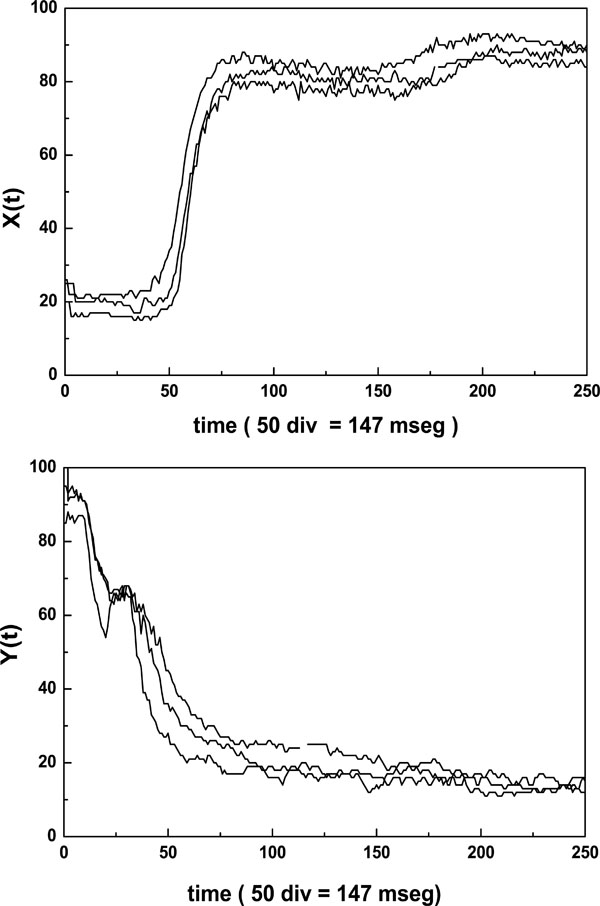
Fig. (2) Typical creep X(t) and recovery Y(t) curves of diffracted intensity measured along the major axis of the elliptical pattern corresponding to first file recorded by the erythrodeformeter. Note that the first 56 data points represent the transitory regime.