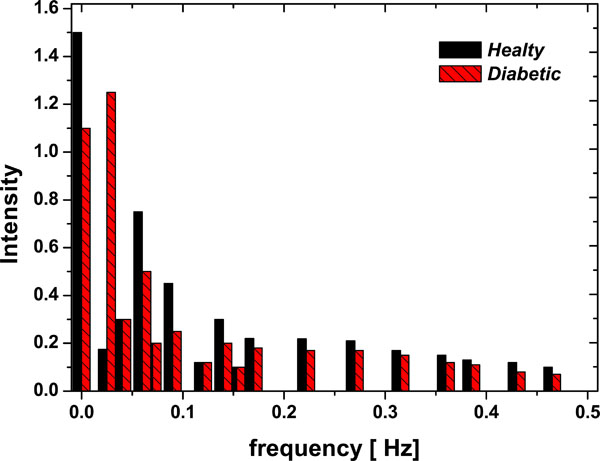
Fig. (3)
FFT – Fourier Power Spectrum (Intensity
vs
Frequency) for one Diabetic patient and one Healthy Control samples.