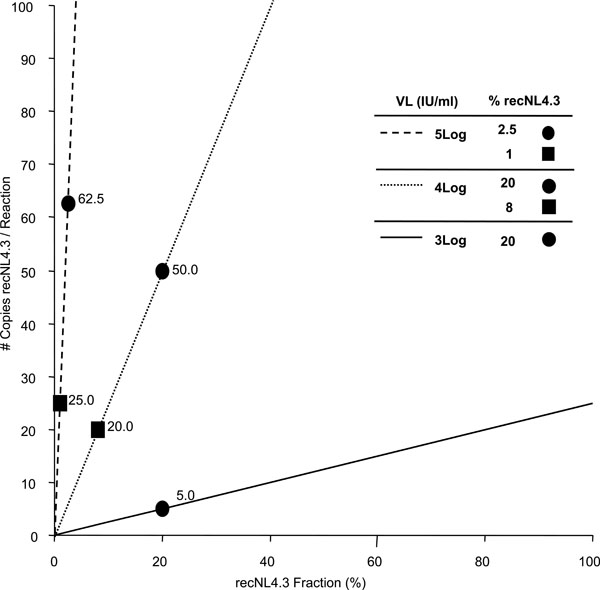
Fig. (1) Visualization of the theoretical number of copies of recNL4.3 in each RT-PCR reaction. X-axis: percentage of the minority species recNL4.3 in the total amount of amplifiable RNA genomes; Y-axis: number of copies of the minority species per RT-PCR reaction. The number of copies per reaction is function of the viral load and experimental procedure. Dashed line: 5 log VL; dotted line: 4 log VL; solid line: 3 log VL. Experimental conditions (viral load, sample amount in RNA extraction, RNA input in RT-PCR) influence the slope of the lines. This figure represents the applied conditions.