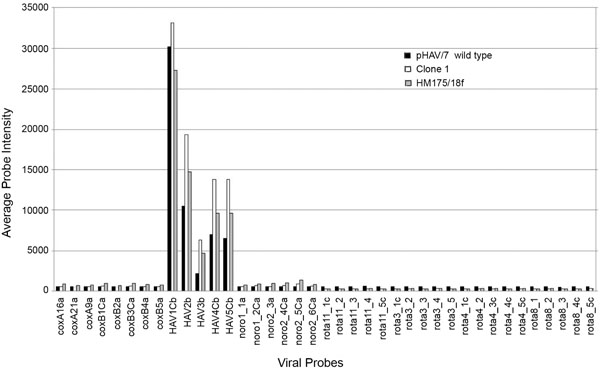
Fig. (5) Comparison of hybridization profiles for three HAV genotype Ib strain targets. Average signal probe intensities were calculated and plotted following hybridization of targets generated as PCR products from reverse transcription of RNA derived from either in vitro transcribed pHAV/7 (black bar), HAV HM175 clone 1 infected cells (white bar) or clarified supernatant from HAV 18f infected cells (grey bar).