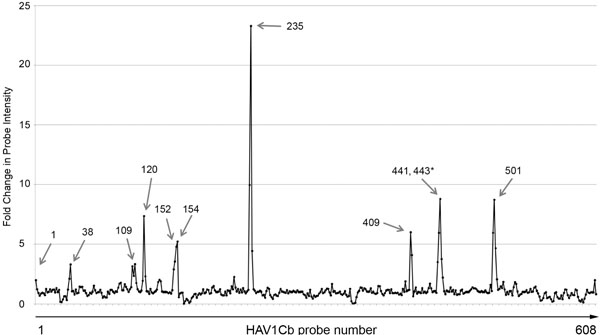
Fig. (6) Detection of nucleotide differences between two genetically related HAV strains. Average signal probe intensities were calculated following hybridization of targets generated as PCR products from reverse transcription of RNA derived from HAV HM175 clone 1 infected cells or clarified supernatant from HAV 18f infected cells. The amplified targets (3.7 kb) derived from both clone 1 and 18f contain nucleotide sequences synonymous with the first 2.7 kb (probes 1- 543) of the 3.1 kb group 1 (HAV1Cb; Fig. 1) consensus sequence used to develop the HAV1Cb probe set that is comprised of 608 probes. The individual points on the graph represent specific probe numbers; however, due to graphical compression of the original data, there are iterative probes not represented by individual points on the graph. Arrows identify the probe number having the peak intensity difference between clone 1 and 18f where a nucleotide(s) present in the consensus sequence is identical to nucleotide(s) in clone 1 but not identical to nucleotide(s) in 18f.