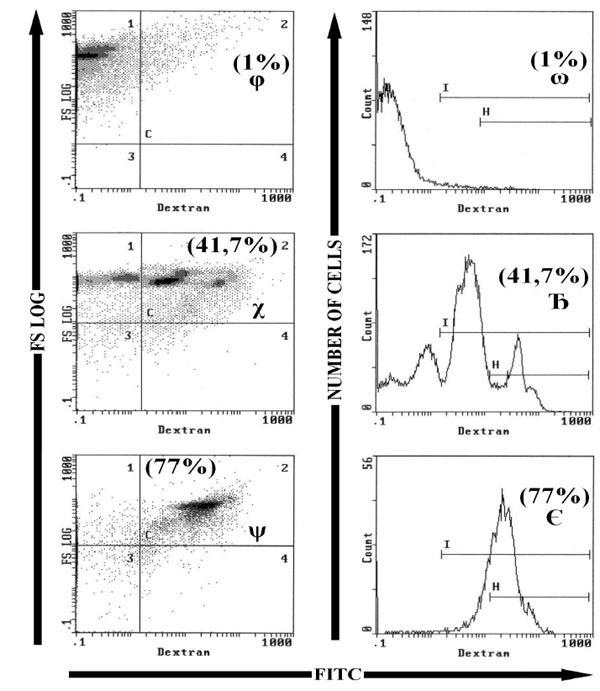
Figure 4 Flow cytometric analysis of necrotic PBMC stained with FITC-Dextran. Healthy donors PBMC were heated at 50°C or 60°C for 1 hour, stained with FITC-Dextran and analyzed by flow cytometry. The numbers in parenthesis are the mean percentage observed with 16 healthy donors; each one tested two times.The histograms at the top show the background staining observed with the live control cells (1% dead cells targeted by the cursor I), histograms located in the middle show the cells heated at 50°C, histograms at the bottom show the cells heated to 60°C. The left histograms (ϕ, χ, ψ) are bi-parametric, log FS versus green fluorescence (FITC-Dextran). The right histograms (ω, Ђ, Є), are mono-parametric and show the percentage of cells with various fluorescence intensity after staining with FITC-Dextran.On the histogram Ђ each peak corresponds to different stages of necrosis, on the histogram ψ there is a single peak corresponding to dead cells