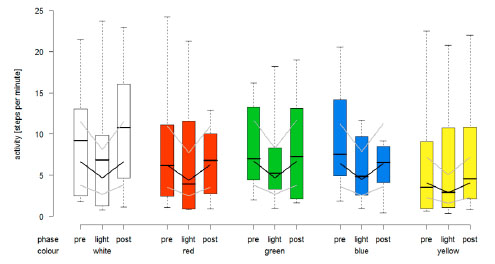
Fig. (4) Activity [steps per minute] in relation to colour and experimental phase (pre-, light-, post-phase). Raw data are given as boxplots with medians, interquartile and absolute ranges, in addition to model predictions with estimated means (black lines) and 95% confidence intervals (grey lines).