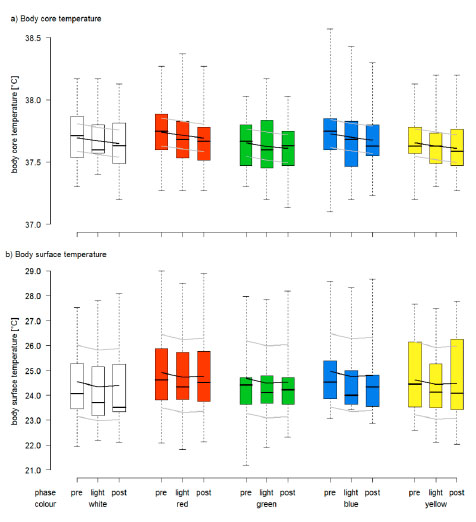
Fig. (7) a) Body core temperature [°C] and b) Body surface temperature [°C] in relation to colour and experimental phase (pre-, light-, post-phase) measured subsequent to the respective phase. Raw data are given as boxplots with medians, interquartile and absolute ranges, in addition to model predictions with estimated means (black lines) and 95% confidence intervals (grey lines).