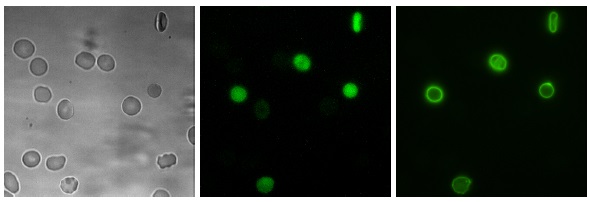
Fig. (2)
Images of RBCs from a typical experiment. Here, doublestaining with two dyes was performed and the signals fo the dys was separated into two different images Left: Brightfield image. Middle: Corresponding fluorescence image with fluorescence dye Fluo-4. Right: Corresponding colourmapped fluorescence image with the fluorescence dye annexin-FITC. Note the fluorescence signal on the outer cell membrane.