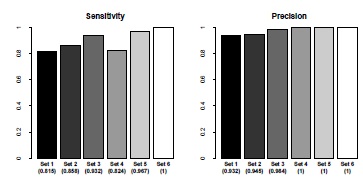
Fig. (4)
Sensitivity and positive predictive value for cell detection. The set numbers correspond to the set numbers in Table 1. The labels refer to the respective image sets, the numbers in parenthesis are the calculated statistical values. The raw statistical values are listed in Appendix Table 3.