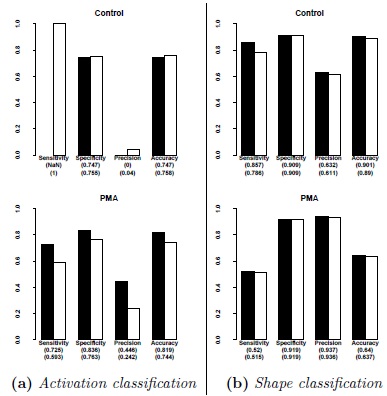
Fig. (7)
Comparison of experimenter annotations with the program results. Plots indicate the results two experiments. In the first one, the activator PMA was deployed and a set of 8 brightfield images with their fluorescence counterparts were taken. The second experiment serves as a control experiment without activator with overal 9 brightfield images and corresponding fluorescence images. IN both cases, the dye Fluo-4 was used. The two experimenter annotations were considered as two different gold standards and used for calculating sensitivity, specificity, positive predictive value and accuracy. For the raw statistical values, refer to Appendix Tables 6 and 7. Sub Fig (a) depicts two plots for activation classifcation, Subfigure (b) shows two plots for shape classification for discocytes. Control describes the experiment without an activator, PMA denotes the experiment where the activator PMA was used. Results for the first experimenter are marked in black, while the values for the second experimenter are marked in white.