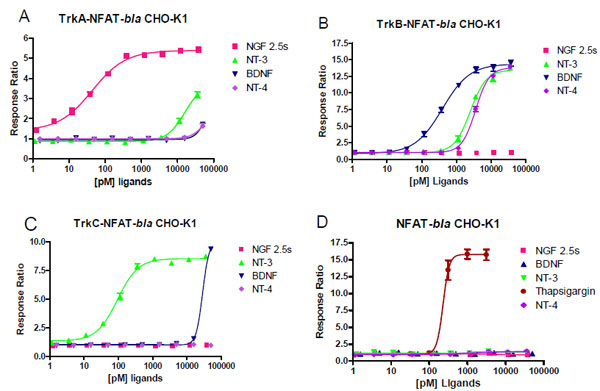
Fig. (2) Neurotrophin dose responses of TrkA, TrkB, TrkC and parental NFAT-bla CHO-K1 cell lines. TrkA-NFAT-bla CHO-K1 (A), TrkB-NFAT-bla CHO-K1 (B), TrkC-NFAT-bla CHO-K1 (C), and parental NFAT-bla CHO-K1 (D) cells were stimulated with NGF (■), BDNF (▲), NT-4 (♦), NT-3 (▼) and Thapsigargin (●, parental cells only) over the indicated concentration range in the presence of 0.1% DMSO for 5 hours before beta-lactamase assay was performed as described in Methods. Response Ratios were plotted for the indicated concentrations of each ligand (n=5 for each data point).