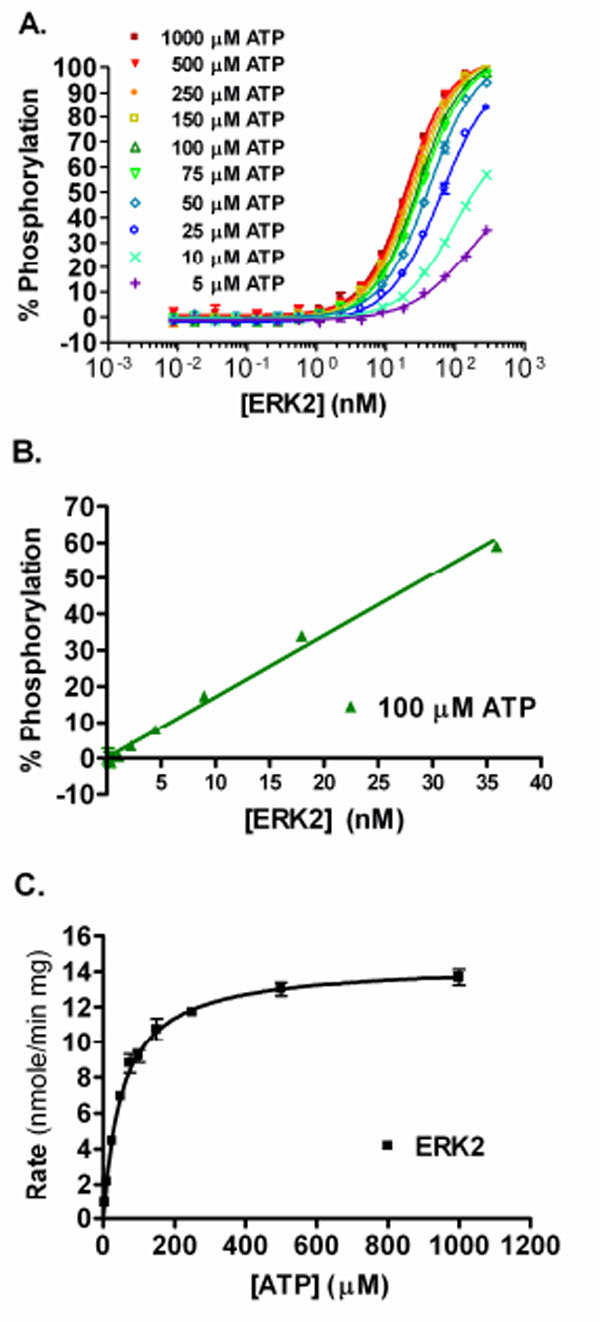
Fig. (2) ERK2 Direct FRET Assay. (A) The % phosphorylation achieved with increasing active ERK2 in a direct assay using various ATP concentrations. (B) Linear plot of the percent phosphorylation achieved for the ERK2 direct assay with 100 µM ATP, with R2 ≥ 0.99. (C) The % phosphorylation was converted to rate (nmole/min/mg) and plotted versus ATP concentration in order to determine the Vmax and ATP Kmapp (14.5 nmole/min/mg and 54 µM, respectively). All data points are the average of duplicate determinations.