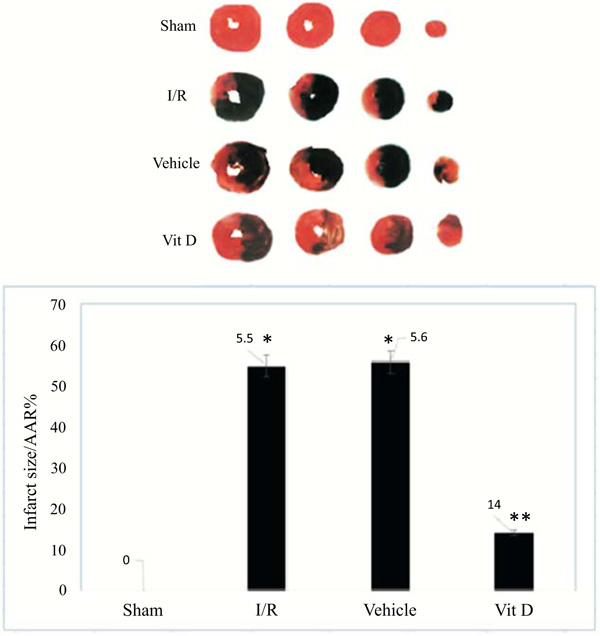
Fig. (6)
Analysis of Area At Risk (AAR) of the heart in mice groups
A. Analysis of AAR, the hearts were stained with Evans blue dye, with four sections. B. AAR was calculated as a percentage of total AAR. Data are shown as mean ± SEM (n = 8 in each group); **P < 0.05 vs. sham; **P < 0.05 vs. I/R/vehicle group.