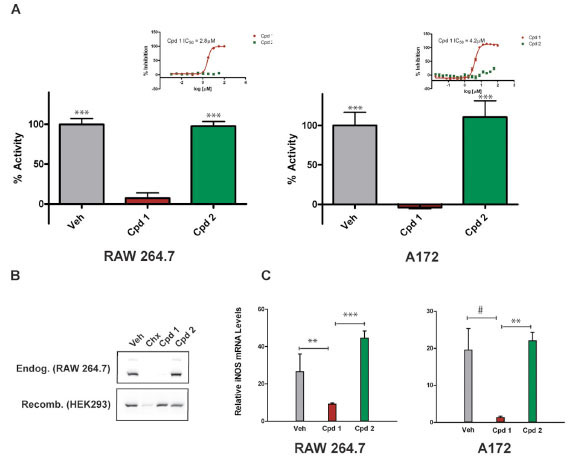
Fig. (2). Compound 1 inhibits iNOS enzymatic activity and reduces iNOS protein and mRNA levels Panel A. Compound 1 (Cpd 1) inhibits cellular iNOS activity in both murine RAW264.7 macrophages and human glioblastoma A172 cells at 10 µM. Compound 2 (Cpd 2) does not affect iNOS activity in either cell-line compared to Vehicle (Veh). Insets show dose-dependent inhibition of iNOS by Compound 1, with IC50 values indicated. The iNOS inhibitor 1400W (100 µM) was used to define 0% enzyme activity (error bars represent SD, *** p < 0.0001 relative to Cpd 1, differences between Veh and Cpd 2 were not statistically significant). Vehicle does not significantly affect NO production relative to no treatment controls (data not shown). Panel B (upper). Immunoblot of endogenous murine iNOS protein from RAW 264.7 cells after 18 hours of simultaneous LPS/IFN-γ stimulation and treatment with the compound indicated. Compound 1 at 10 µM and cycloheximide (Chx) at 1 µM ablate iNOS protein levels. None of the compounds reduced α-tubulin or GAPDH protein levels under these experimental conditions (data not shown). Panel B (lower). Immunoblot of recombinant murine iNOS heterologously expressed in HEK293 cells. Neither Compound 1 (10 µM) nor Compound 2 (10 µM) cause any reduction in iNOS protein levels relative to vehicle. Samples were normalized for total protein. Panel C. Measurement of iNOS mRNA transcript levels using SYBR-green quantitative real-time PCR. RAW264.7 and A172 cells were simultaneously stimulated with pro-inflammatory media and treated with vehicle (Veh), Compound 1 (10 µM), or Compound 2 (10 µM) for 6 hours. Transcript levels for iNOS were normalized to GAPDH and data shown as relative expression by treatment (error bars represent SD, ** p = 0.01, *** p = 0.0001, # p = 0.045 ). Uninduced RAW 264.7 cells and A172 cells contain extremely low quantities of iNOS transcripts, approximately 150-times and 140-times less than compound 1-treated cells, respectively (data not shown).