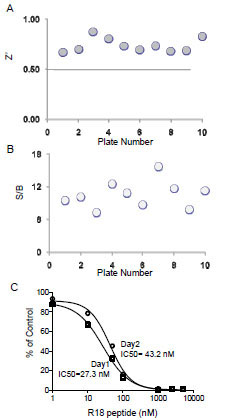
Fig. (7) Evaluation of the 14-3-3 AlphaScreening assay for HTS. The binding assay was performed essentially as described in Fig. (4), using biotin-14-3-3γ (5 nM) and GST-R18 (15 nM) and 10 assay plates (384-well). (A) Z’ factor for the 14-3-3 AlphaScreen assay. The Z’ values across the 10 plates were consistently higher than 0.7. (B) The S/B values, calculated for each of the 10 plates, were all above 7. (C) Day to day variation. Day to day precision was assessed by comparison of 2 representative dose-response competition curves of R18 peptide which were performed on 2 different days. Results are shown as a percentage of control Alpha signal (obtained in the absence of inhibitor) after subtracting the background (biotin-14-3-3 only). Data are expressed as means ± SD from triplicate determinations.