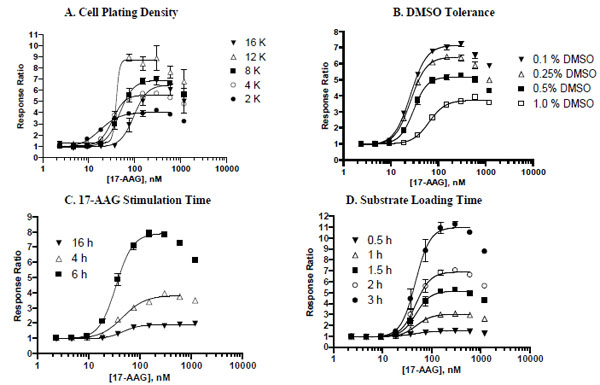
Fig (5) Assay optimization and performance testing in 384-well format. (A) Cell plating density testing. The assay was performed by plating 2,000 cells/well (●), 4,000 cells/well (○), 8,000 cells/well (■), 12,000 cells/well (∆), and 16,000 cells/well (▼). Response ratios were plotted against 17-AAG concentration. Data are mean ± SE of n = 4 values. (B) DMSO tolerance testing. The assay was performed using 8,000 cells/well and stimulating them with 17-AAG in the presence of 0.1% DMSO (▼), 0.25 % DMSO (∆), 0.5 % DMSO (■), or 1.0 % DMSO (□) prior to the assay. Data are mean ± SE of n = 8 values. (C) 17-AAG stimulation time. The assay was performed using 8,000 cells/well and stimulating the cells for 4 (∆), 6 (■) or 16 hours (▼). Data are mean ± SE of n = 8 values. (D) Substrate loading time evaluation. The assay was performed using 8,000 cells/well and 5 hr stimulation in the presence of 0.1 % DMSO and reading the plate at 0.5 (▼), 1 (∆), 1.5 (■), 2 (○) and 3 (●) hours following substrate addition. Data are mean ± SE of n = 8 values.