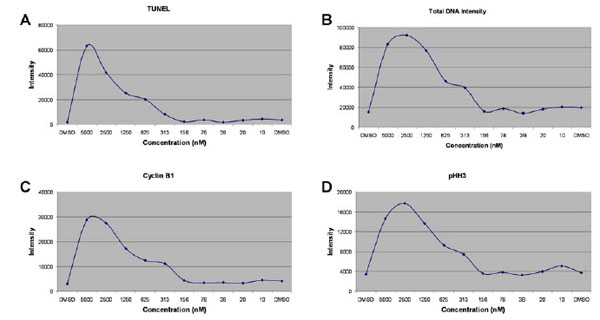
Fig. (1). Aggregate cellular responses to treatment with a PLK1 inhibitor Four phenotypic parameters were measured from HCT 116 cells exposed to an inhibitor of PLK1 in a concentration response curve for 48 hours. The aggregate phenotypic responses from TUNEL apoptotic staining (A), total DNA intensity (B), cyclin B1 expression (C), and presence of pHH3 (D) are shown in a concentration range of 5000 nM to 10 nM. Intensity values are shown as relative fluorescent units.