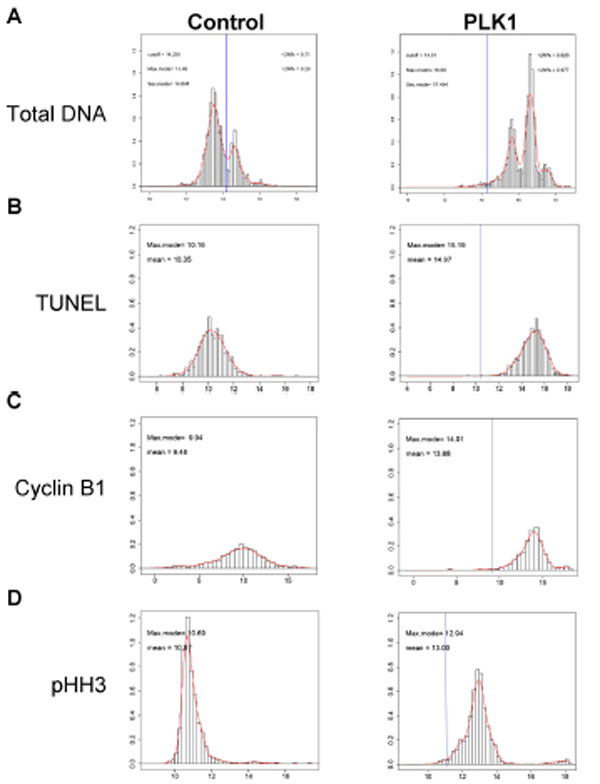
Fig. (2). Distribution analysis of phenotypic parameters distinguish subpopulations Distributions were performed of the individual cellular data for the four phenotypic parameters shown in Fig. (1). These data were taken from the same HCT 116 cells treated with 2500 nM PLK1 inhibitor for 48 hours. Total DNA (A), TUNEL (B), cyclin B1 (C), and pHH3 intensity (D) data were log2 transformed and distributed according to intensity. The blue lines shown in the PLK1 treatments represent the mean of the control population.