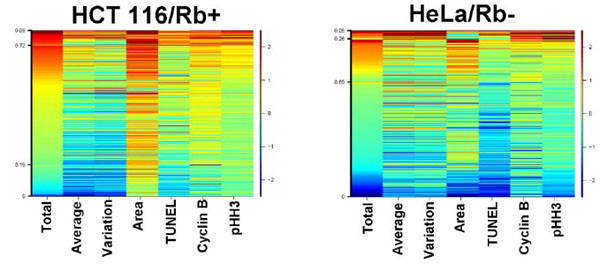
Fig. (3). Bivariate analysis of phenotypic parameters further refine subpopulations Distribution analysis data used in Fig. (2) (green bars at top and side) were combined to further differentiate subpopulations. Total DNA intensity data were combined with TUNEL data (A) and cyclin B1 data were combined with pHH3 data (B). Topographic mapping demonstrates clustering concentrations (red coloring illustrates closest clustering, and blue furthest clustering).