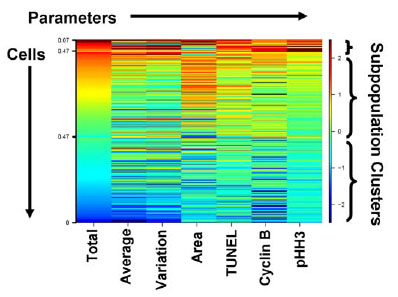
Fig. (4). Diagram of a multiparametric heatmap The phenotypic fingerprint of each imaged cell is shown from left to right in a single row across the heatmap and is characterized by the 7 parameters: total, average, and variation of DNA intensity, nuclear area, TUNEL apoptotic staining, cyclin B1 expression, and the presence of pHH3. These parameters are shown in columns along the bottom of the heatmap. Cells were clustered vertically using unsupervised K-means based on those 7 parameters and are grouped within each cluster based upon their total DNA intensity from highest to lowest. The blue to red shifts present in the heatmap represent deviations away from the mean of a control population in standard deviations (shifts to red are increases and shifts to blue decreases).