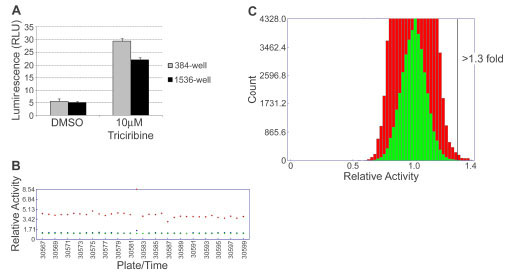
Fig. (5) CLCN1-luc assay miniaturization and HTS validation in immortalized DM1 myoblasts. (A) CLCN1-luc DM1 myoblasts were treated with 10 µM Triciribine for 24 h prior to luciferase activity readout (RLU = relative luciferase units) in 384-well and 1536-well formats. Data points are an average of 3 (384-well) or 6 (1536-well) replicates, and error bars represent standard deviation. (B) Activity trace of HTS of ~13,000 compounds (in triplicate) against CLCN1-luc in DM1 myoblasts in 1536-well format, showing plate median values of DMSO negative control wells (blue), Triciribine positive control wells (red), and test compounds (green), expressed as fold change relative to DMSO. An assay window of 4-fold was maintained throughout the screen (CV = 9% and Z´ factor = 0.5). (C) Histogram of normalized luciferase expression data (green) from HTS of ~13,000 compounds, indicating threshold of >1.3 fold change (relative to DMSO) used to determine a hit rate of 0.26%. Red indicates 10x activity.