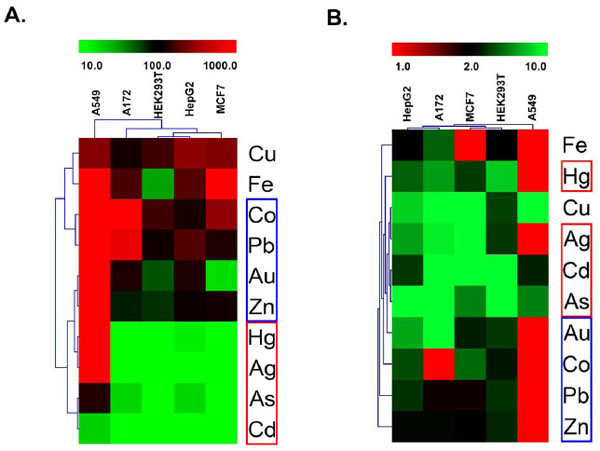
Fig. (4) Hierarchical clustering of Nrf2 response patterns. Cell responses for the ten active metals were clustered using CD (A) and maximal activity (B) derived from the concentration-response curves. Response class I compounds (red boxes) elicited Nrf2 activities in all tested cell models. Response class II compounds (blue boxes) elicited the most significant Nrf2 activities at the lowest concentrations in a subset of cell models. Response class III (violet boxes) generally stimulated milder Nrf2 activities than those in response classes I and II and only at the highest concentrations tested.