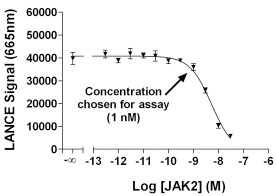
Fig. (2). Example competition curve The competition curve for JAK2 kinase was performed according
to Materials and Methods. The fluorescence signal was plotted
versus the concentration of enzyme and the highest concentration of
enzyme providing minimal or no interference of signal was chosen
for determination of activity versus the various ULight-substrates.
In this case, 1 nM kinase was chosen. The error bars represent the
standard deviation of triplicate measurements.