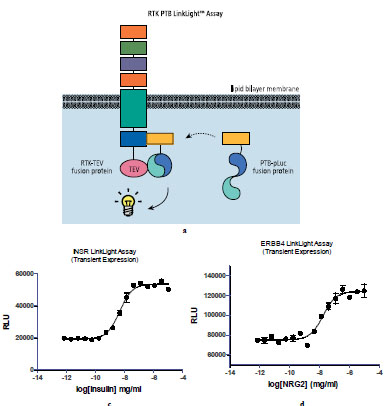
Fig. (3) RTK LinkLight Assay. a, A schematic drawing of RTK-TEV and PTB-pLuc interaction LinkLight assay. b, U-2 OS cells stably expressing PTB-pLuc and transiently expressing INSR-TEV genes showed dose-response curve in response to the ligand insulin. c, U-2 OS cells stably expressing PTB-pLuc and transiently expressing ErbB4-TEV genes showed dose-response curves in response to the ligand NRG2. Data points are represented as mean ± SD from n=3. EC50 values were derived from non-linear regression with the best-fit equation.