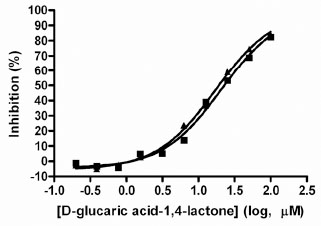
Fig. (6)
IC
50
value determinations using the automated GUS assay.
Data points represent the average of three determinations per concentration and error bars represent standard deviations. Data are representative of two independent experiments.