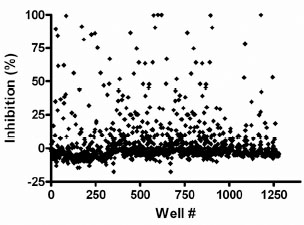
Fig. (7)
Screen of the Prestwick collection with the GUS assay.
Each point represents a compound. The percent inhibition values were calculated relative to controls on the plates.