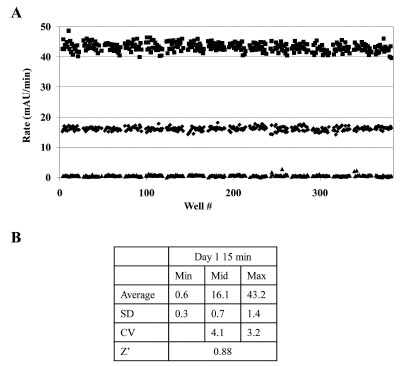
Fig. (5) GAPDHS assay variability assessment. (A) 384-well plates were pre-spotted with 0.5 µL of DMSO using a Biomek NX. One plate
each was used to determine the maximum signal (■), mid signal (♦) and minimum signal (▲). The Min, Mid and Max plates contained final
assay concentrations of 0, 16 and 32 nM GAPDHS respectively. After 15 min of pre-incubation, GAP was added and rates determined over 5
min with 30 sec reads. The data represent values measured in individual wells, consisting of 320 replicates for each condition. (B) The variability
for inhibition was determined from the max and min plates. Z’-factors, standard deviations (SD) and coefficient of variance (CV)
were calculated in Excel.