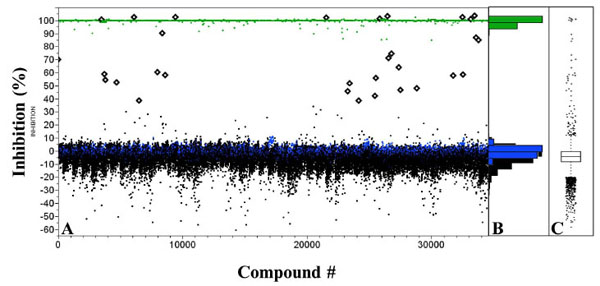
Fig. (7) High throughput screening of human GAPDHS. Compounds were pre-spotted (0.5 µl) into 384-well plates and the human GAPDHS
enzyme assay carried out in a final volume of 50 µl as described in the materials and methodology. (A) Scatterplot showing percent inhibition
values for compounds screened and with actives shown as diamonds above a 3 sigma threshold. Positive controls are shown in green, negative
controls in blue and Asinex compounds in black. (B) Histogram of screening data showing a normal distribution and, (C) Box plot representing
quartiles and outliers.