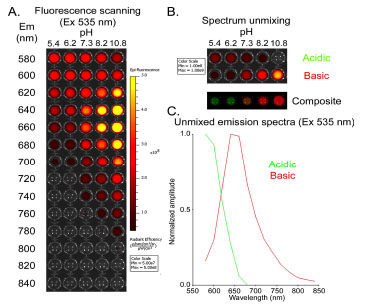
Fig. (1). Fluorescence spectral unmixing of SNARF ligand at different pH (A) SNARF ligand fluorescence was assessed across the indicated pH range by sequential imaging using a fixed excitation filter at 535 nm. Fluorescence emission was acquired from 580 nm to 840 nm. (B) The acidic and basic SNARF fluorescent components were reconstructed after spectral unmixing. A composite image was generated with green and red pseudocolors representing the acidic and basic fluorescence respectively. (C) The unmixed spectra of the acidic (green) and basic (red) fluorescence of SNARF in vitro.