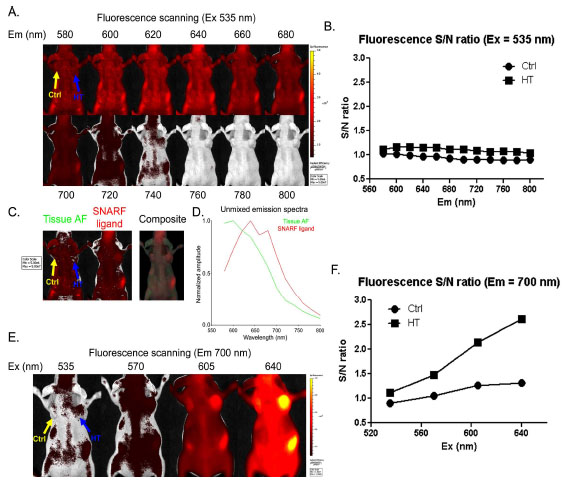
Fig. (3). In vivo spectral property of SNARF HaloTag ligand NCr nude mice were subcutaneously inoculated with HCT116 control (left, yellow arrow) and HCT116–HT (right, blue arrow) cells. Mice with established tumors received intravenous injection of SNARF-1 ligand. Sequential planar fluorescence images were acquired 1 day after probe injection with a fixed excitation wavelength at 535 nm. (A) Fluorescence was imaged with emission filters spanning 580-800 nm. (B) S/N ratios were calculated using the neck as background. (C) Two fluorescence components were reconstructed by spectral unmixing, one representing the tissue autofluorescence (AF) and the other representing the SNARF fluorescence. A composite image was generated using green and red pseudocolors for tissue AF and SNARF signals respectively. (D) The unmixed spectra for the tissue AF (green) and SNARF signals (red) shows considerable overlap. (E) Optimal SNARF excitation was determined spanning 535-640 nm with a fixed emission at 700 nm. (F) Optimum excitation at 640 nm provides deeper penetration and stronger SNARF fluorescence with highest S/N ratios.