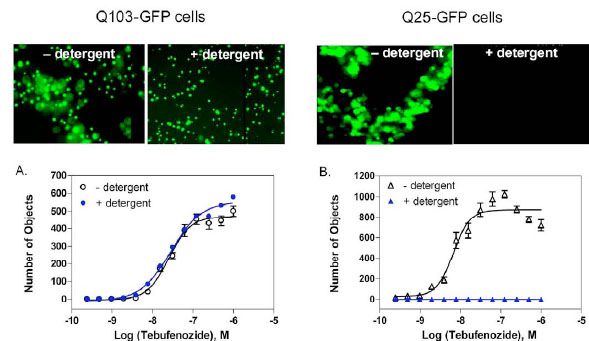
Fig. (2) Differentiation of the fluorescent signals from aggregated Q103-GFP and non-aggregated G25-GFP fusion proteins by a laser scanning
cytometer plate reader before and after detergent treatment. Microscopic images were captured using a 20! objective on an inverted epifluorescence
microscope. In Q103-GFP cells, the detergent treatment did not disrupt the protein aggregates attached to the bottom of an assay
plate, while soluble proteins in Q25-GFP control cells diffused away from the bottom of the plate and were not visible after detergent treatment.
(A) In Q103-GFP cells, the concentration response curves of the inducer tebufenozide were similar in the presence and absence of detergent.
(B) In Q25-GFP control cells, no fluorescent signal was detected after detergent treatment because the fusion protein was dispersed
into the medium and only the fluorescence signal at the bottom of an assay plate was measured by the reader.