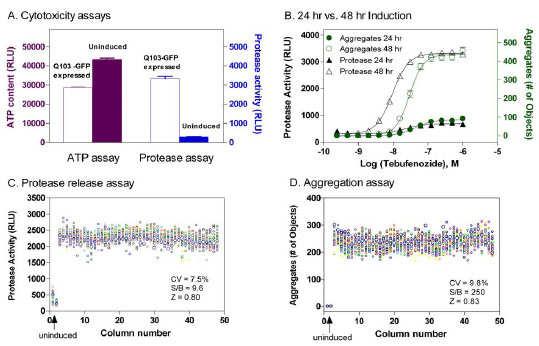
Fig. (3) (A) Comparison of an ATP content assay and a protease release assay for measurements of cytotoxicity resulted from the expression of
Q103-GFP fusion proteins in the Q103 PC12 cells. The expression of Q103-GFP fusion proteins in these cells was induced by 48 hr treatment
with the inducer tebufenozide. (A) In the ATP content assay, 30 to 50 % reduction in ATP levels caused by the fusion protein cytotoxicity was
observed in the cells treated with the inducer tebufenozide compared with that in untreated cells, resulting in a signal-to-basal (S/B) ratio of 1.4
fold. In the protease release assay, the protease activity due to the cytotoxicity was dramatically increased in the cells treated with the inducer
tebufenozide compared with that in untreated cells (n=4 for each data point). The average S/B ratio was 9 fold. Thus, the protease assay produced
a better assay window and was selected for the measurement of cytotoxicity in our experiments. (B) Concentration response curves of inducer
tebufenozide determined in Q103-GFP cells after 24 or 48 hr treatment. The average S/B ratios in both protease and aggregation assays were
much higher after 48 hr incubation with the inducer tebufenozide than these after 24 hr incubation. The EC50 values of tebufenozide determined
from the protease release cytotoxicity assay and protein aggregation assay were 9.5 and 29.6 nM, respectively (n=12 for each data point). (C)
Scatter plot of a DMSO plate test in the protease release assay. (D) Scatter plot of a DMSO plate test in protein aggregation assay. Both results in C
and D were obtained from the same assay plate in a multiplexed assay experiment. In both panel C and D, the wells in columns 1 and 2 were not
treated with inducer (e.g. negative control) and wells in columns 3 through 48 were treated with 200 nM Tebufenozide for 48 hours. Uninduced cells
exhibited virtually no detergent insensitive fluorescence signal (D). All the wells also received 0.46% DMSO, a solvent for compounds.