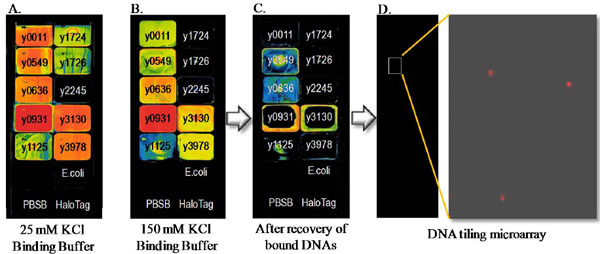
Fig. (6) Protein Microarray and DNA Tiling Microarray to Identify Protein-DNA Interactions. of hypothetical proteins in Y. pestis KIM. Binding of Cy5 labeled sheared genomic DNA onto a 16-pad protein array (A) in low salt binding buffer (25 mM KCl) and (B) in high salt buffer (150 mM KCl). (C) Array image after recovery of the bound DNAs. (D) DNA tiling microarray with the recovered DNA from protein array. The color represents the amount of DNA bound to the proteins. The color scale represents the strongest signals as red followed by orange, yellow, green, blue and black.